| Start Page |
|
 |
| Start Page |
|
|
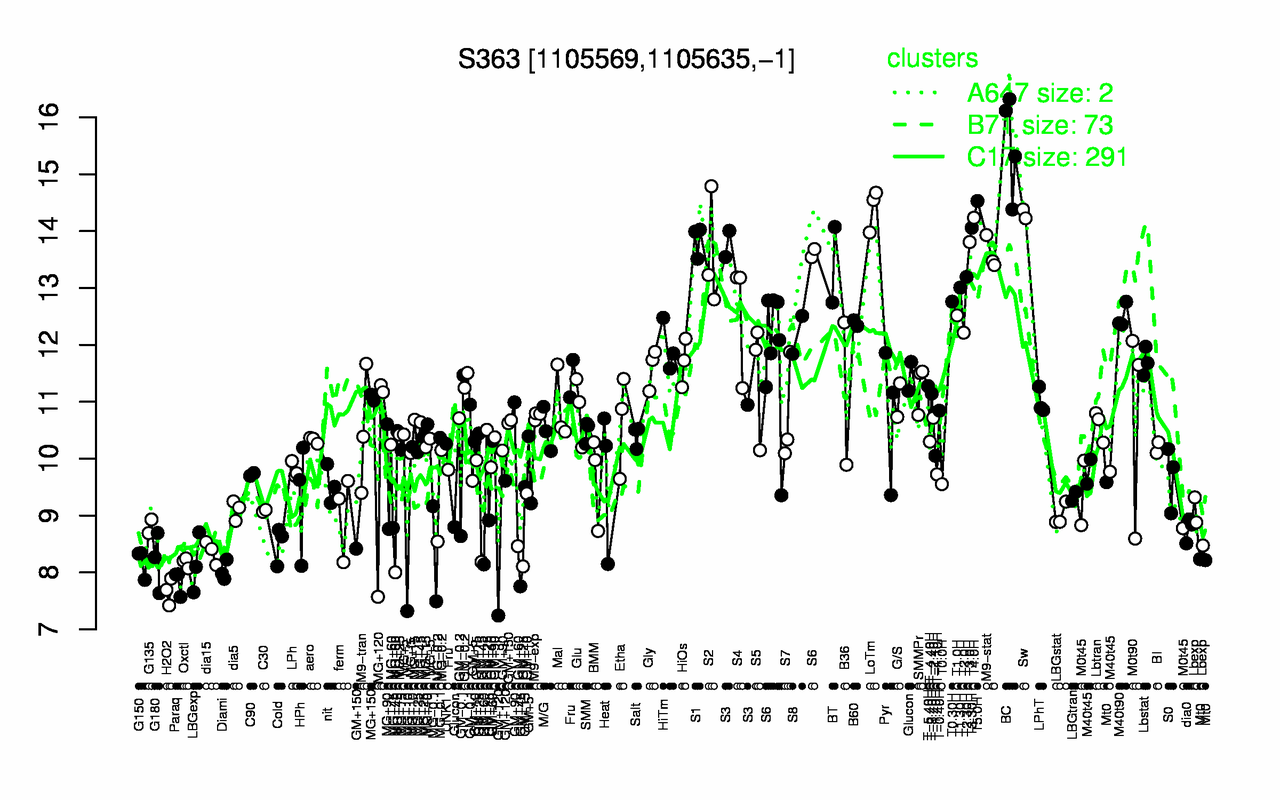
| BC | T5.0H | LoTm | Sw | T4.0H | T3.30H | S1 | T3.0H | S2 | M9-stat |
| 15.5 | 14.5 | 14.4 | 14.3 | 14.2 | 14.1 | 13.8 | 13.8 | 13.6 | 13.6 |
| H2O2 | Paraq | Diami | LBGexp | Oxctl | G150 | G180 | dia15 | GM+120 | Cold |
| 7.67 | 7.83 | 8.03 | 8.15 | 8.17 | 8.18 | 8.2 | 8.36 | 8.43 | 8.5 |