| Start Page |
|
 |
| Start Page |
|
|
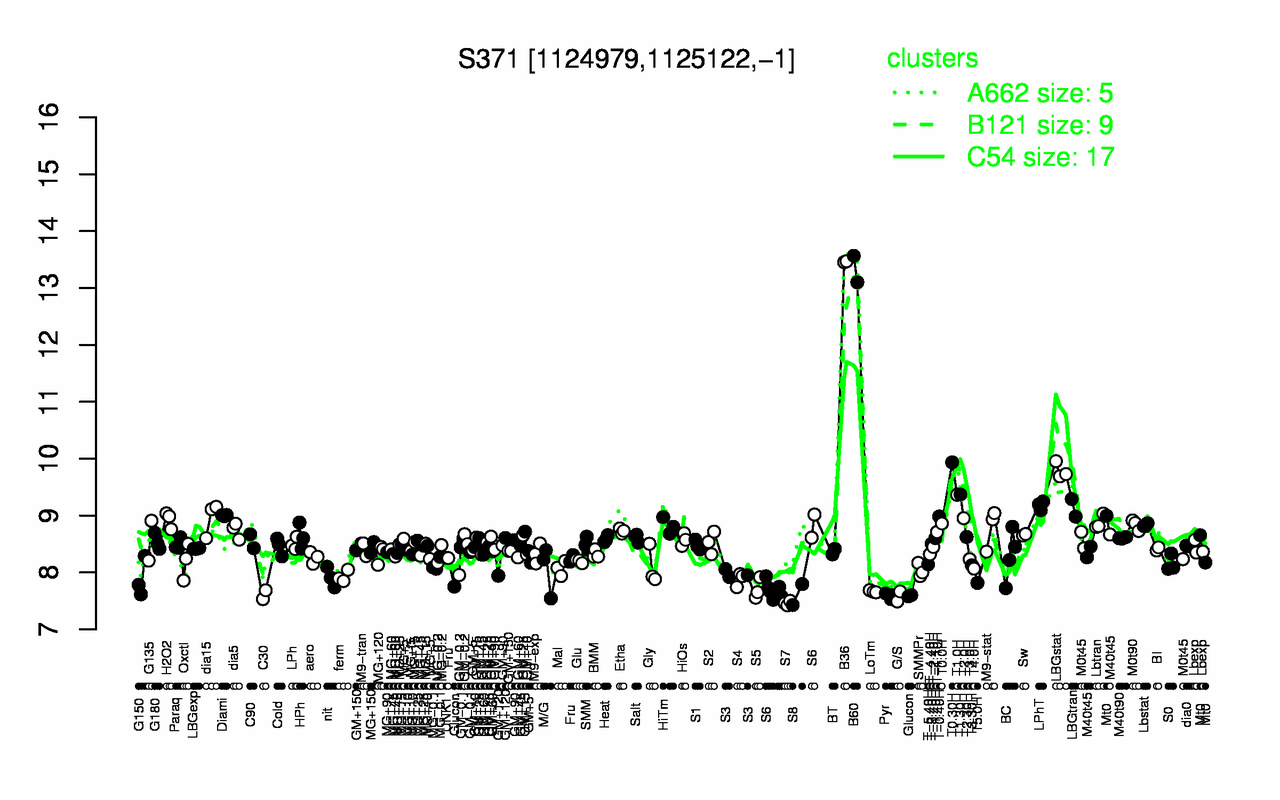
| B36 | B60 | T0.30H | LBGstat | T1.30H | T1.0H | LPhT | LBGtran | Diami | T-0.40H |
| 13.5 | 13.3 | 9.93 | 9.79 | 9.37 | 9.36 | 9.18 | 9.14 | 9 | 8.98 |
| S7 | G/S | Pyr | C30 | S8 | Glucon | LoTm | S5 | T5.0H | S4 |
| 7.46 | 7.58 | 7.59 | 7.61 | 7.61 | 7.64 | 7.67 | 7.71 | 7.82 | 7.88 |