| Start Page |
|
 |
| Start Page |
|
|
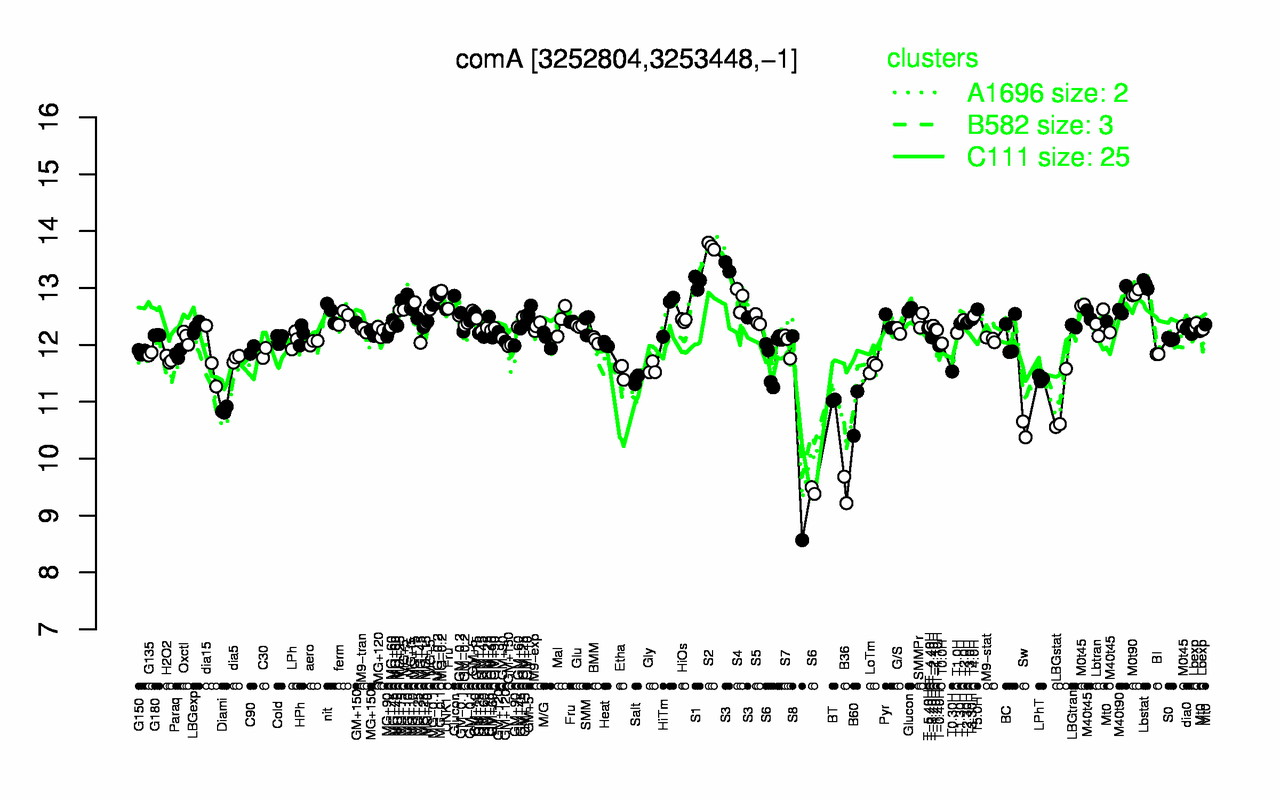
| S2 | S1 | S3 | Lbstat | M0t90 | MG-0.2 | MG-0.1 | S4 | M40t90 | Glucon |
| 13.7 | 13.1 | 13.1 | 13.1 | 12.9 | 12.9 | 12.8 | 12.8 | 12.7 | 12.7 |
| B36 | S8 | Sw | B60 | Diami | LBGstat | BT | S6 | Salt | LPhT |
| 9.45 | 10.4 | 10.5 | 10.8 | 10.9 | 10.9 | 11 | 11.3 | 11.4 | 11.4 |