| Start Page |
|
 |
| Start Page |
|
|
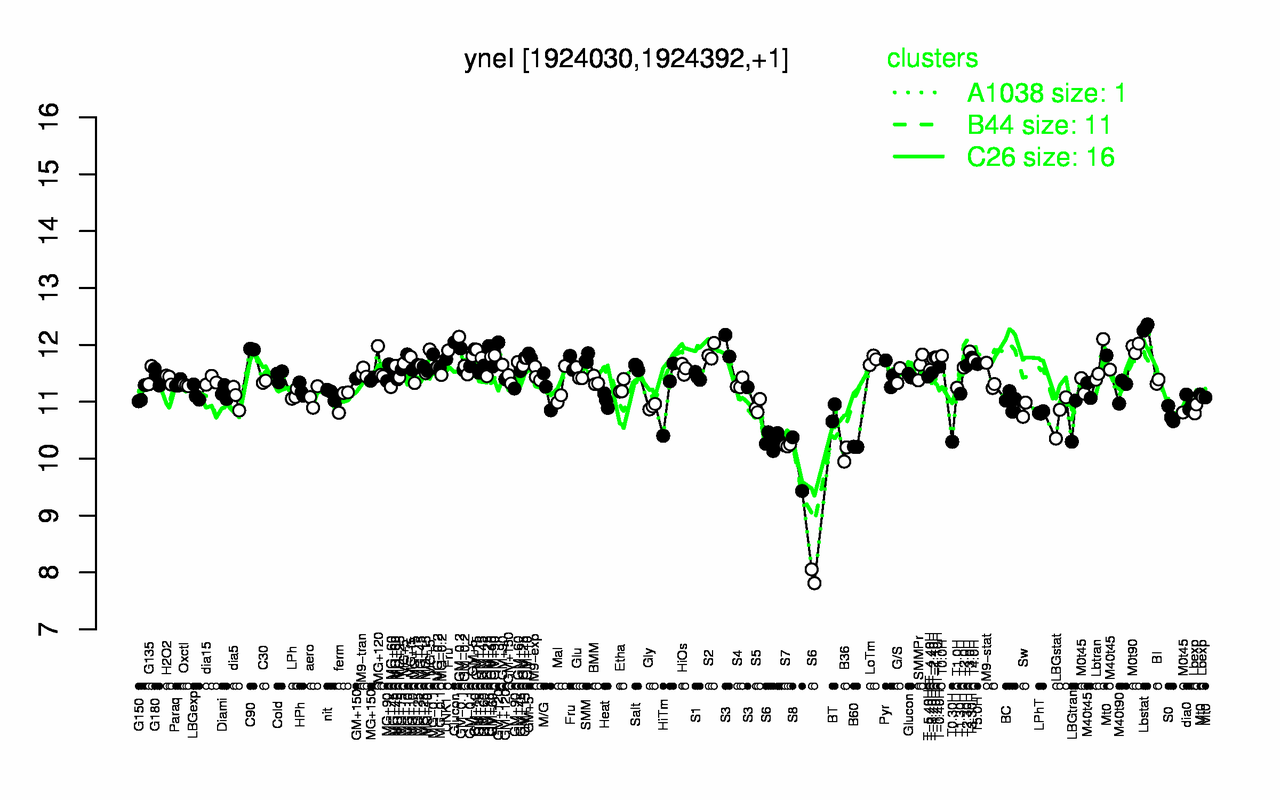
| Lbstat | M0t90 | C90 | GM+15 | T3.0H | S2 | GM+10 | T0.0H | GM+5 | MG+5 |
| 12.3 | 12 | 11.9 | 11.9 | 11.9 | 11.9 | 11.8 | 11.8 | 11.8 | 11.8 |
| S6 | S8 | B36 | B60 | S7 | T0.30H | LBGtran | LBGstat | S0 | BT |
| 9.78 | 9.9 | 10.1 | 10.2 | 10.2 | 10.3 | 10.7 | 10.8 | 10.8 | 10.8 |