| Start Page |
|
 |
| Start Page |
|
|
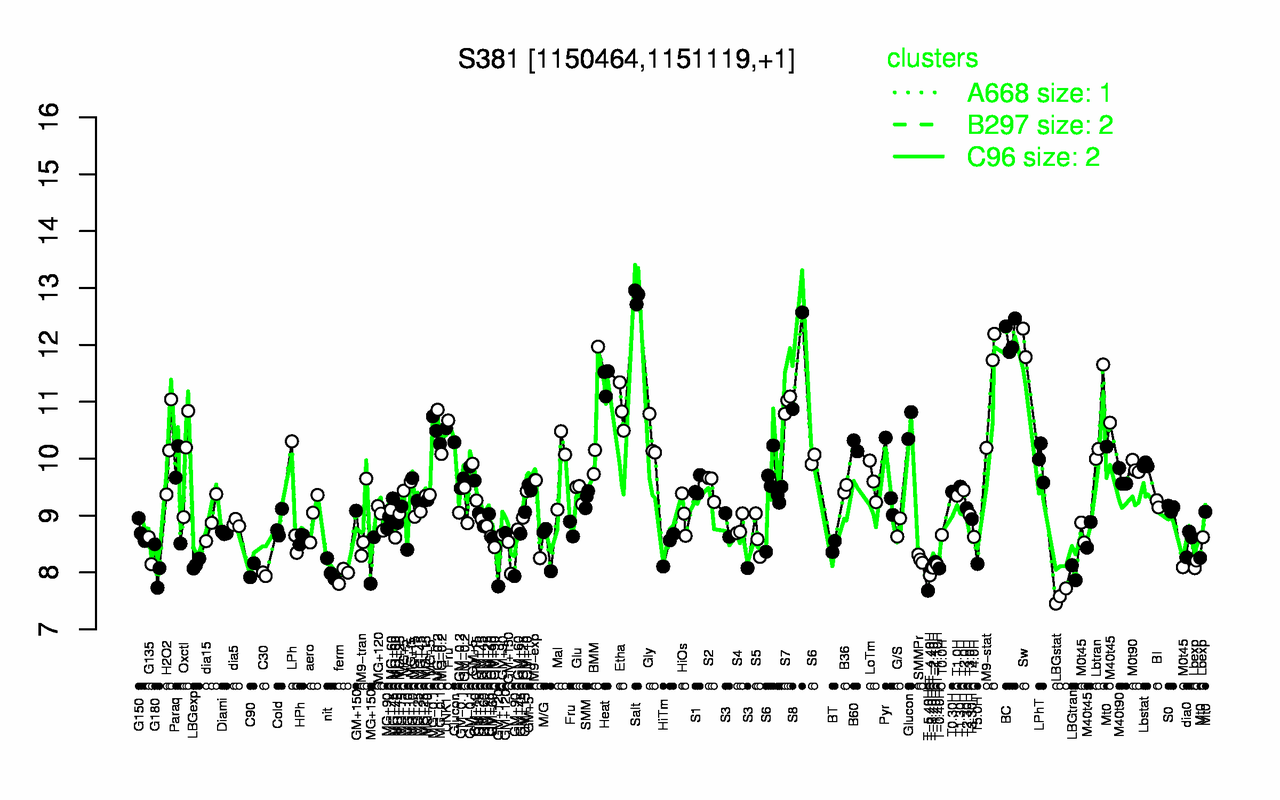
| Salt | BC | Sw | S8 | Heat | M9-stat | S7 | Etha | BMM | Lbtran |
| 12.9 | 12.2 | 12 | 11.7 | 11.4 | 11.4 | 11 | 10.9 | 10.6 | 10.6 |
| LBGstat | T-5.40H | T-4.40H | ferm | C30 | LBGtran | C90 | nit | T-0.40H | T-2.40H |
| 7.58 | 7.68 | 7.95 | 7.95 | 7.97 | 8 | 8.04 | 8.04 | 8.07 | 8.08 |