B. subtilis Expression Data Browser
Start Page
B. subtilis Expression Data Browser
Gene/Segment:
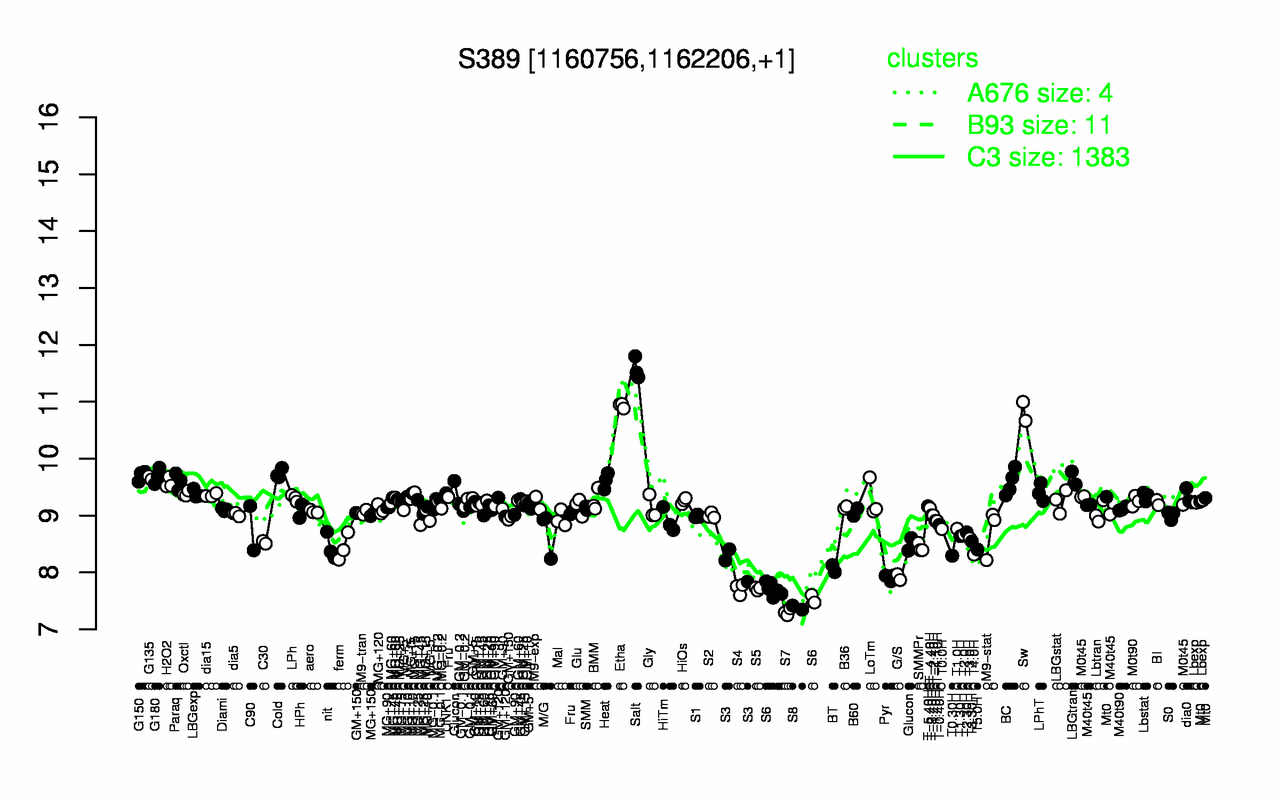
S389
Locus Tag:
new_1160756_1162206
Details about S389
Show/Hide
Highest Expression Conditions
Salt
Etha
Sw
Cold
G150
G180
G135
LBGtran
Heat
Paraq
11.6
10.9
10.8
9.74
9.7
9.69
9.66
9.66
9.61
9.6
Lowest Expression Conditions
S7
S8
S6
S4
S5
Pyr
G/S
BT
S3
T0.30H
7.3
7.38
7.66
7.71
7.72
7.91
7.92
8.07
8.15
8.29
Most Positively Correlated Segments
yisP
menC
menE
ygxA
gtaB
S1127
moaA
yxiS
secA
fdhD
0.95
0.85
0.84
0.8
0.78
0.77
0.77
0.77
0.76
0.76
Most Negatively Correlated Segments
S529
yqzG
yhjR
sspC
S1150
yndM
sspI
sspO
S1359
yutG
-0.77
-0.74
-0.74
-0.74
-0.74
-0.73
-0.73
-0.73
-0.73
-0.73
Expression Profile of Segment S389
Show/Hide
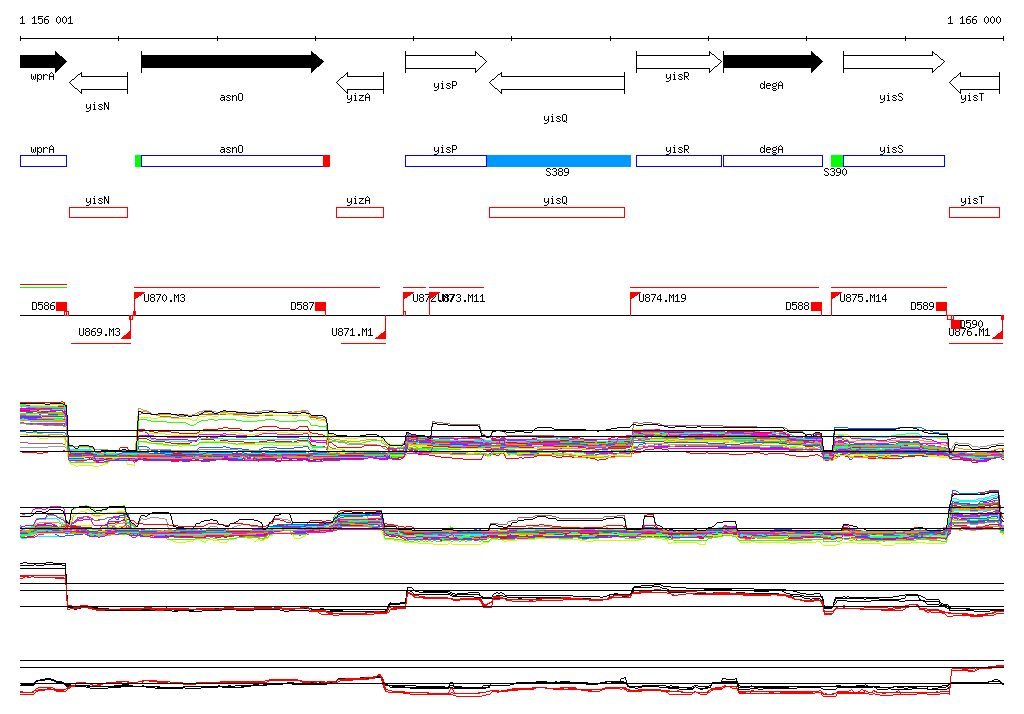
Genomic View of Gene/Segment S389
Show/Hide
(Legend)
Browse Genome Context