B. subtilis Expression Data Browser
Start Page
B. subtilis Expression Data Browser
Gene/Segment:
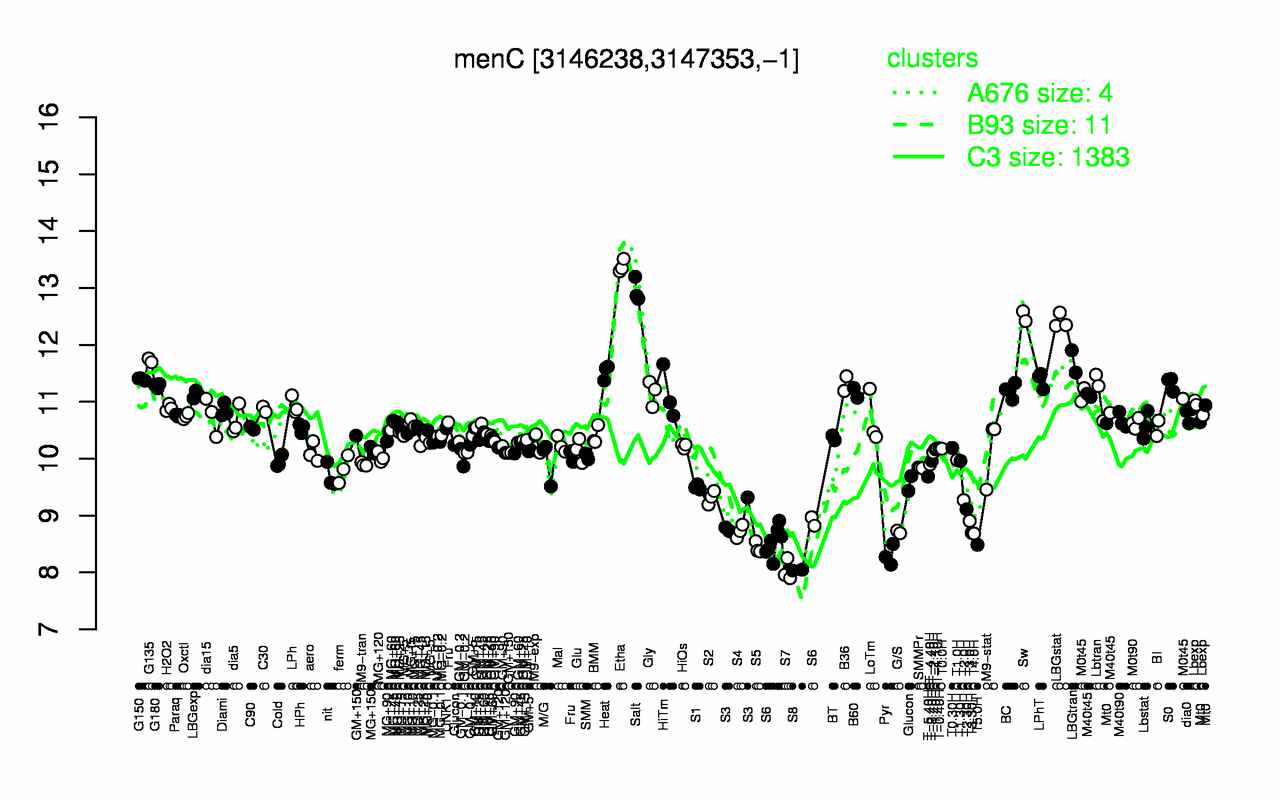
menC
Locus Tag:
BSU30780
Details about menC
Show/Hide
Highest Expression Conditions
Etha
Salt
Sw
LBGstat
G135
LBGtran
Heat
G150
LPhT
S0
13.4
13
12.5
12.4
11.7
11.7
11.5
11.4
11.4
11.3
Lowest Expression Conditions
S7
S8
Pyr
S5
T5.0H
S6
T4.0H
T3.30H
G/S
S4
8.04
8.04
8.3
8.43
8.49
8.62
8.68
8.7
8.71
8.72
Most Positively Correlated Segments
menE
yisP
S389
ykuT
nadE
yrhK
yybB
degA
opuD
moaD
0.98
0.88
0.85
0.8
0.79
0.78
0.78
0.77
0.77
0.77
Most Negatively Correlated Segments
yjbA
S1150
S529
S651
yhfW
S832
yuiC
yjdG
yisI
ybbH
-0.73
-0.69
-0.67
-0.67
-0.67
-0.67
-0.67
-0.67
-0.66
-0.66
Expression Profile of Segment menC
Show/Hide
Annotation of Gene menC
Show/Hide
function
16.10: Respire
function
16.2: Construct biomass (Anabolism)
inference
ab initio prediction:AMIGene:2.0
codon_start
1
EC_number
4.2.1.-
transl_table
11
note
Evidence 1a: Function experimentally demonstrated in the studied strain; PubMedId: 12682299, 6780514, 8566759, 9139683; Product type e: enzyme
db_xref
GI:2635562
product
O-succinylbenzoate-CoA synthase
protein_id
CAB15056.1
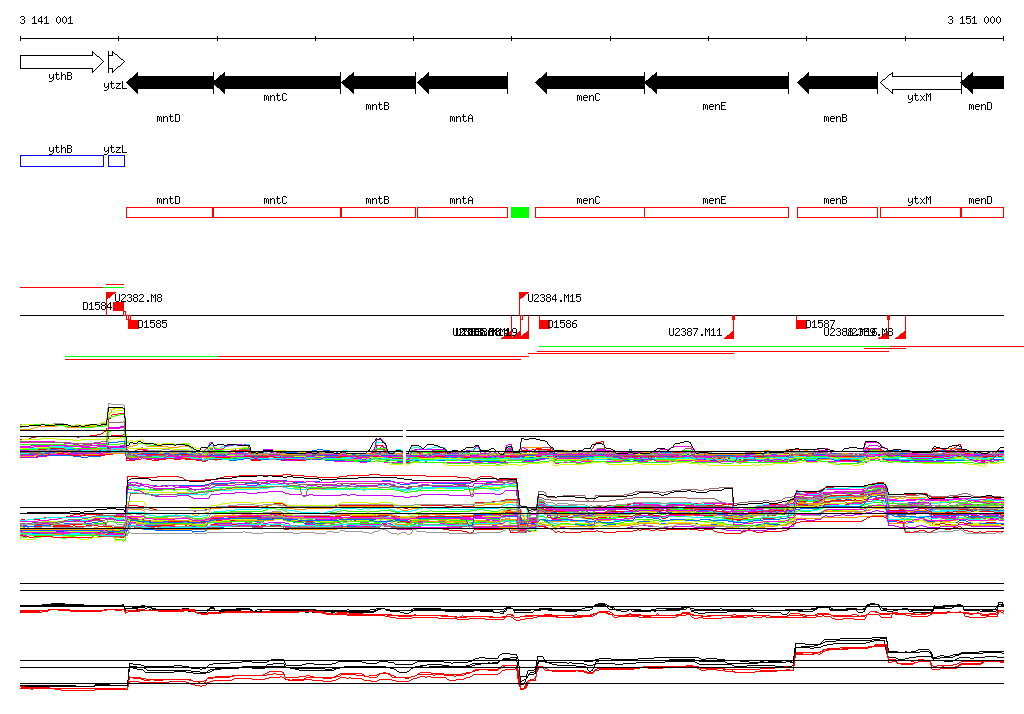
Genomic View of Gene/Segment menC
Show/Hide
(Legend)
Browse Genome Context