| Start Page |
|
 |
| Start Page |
|
|
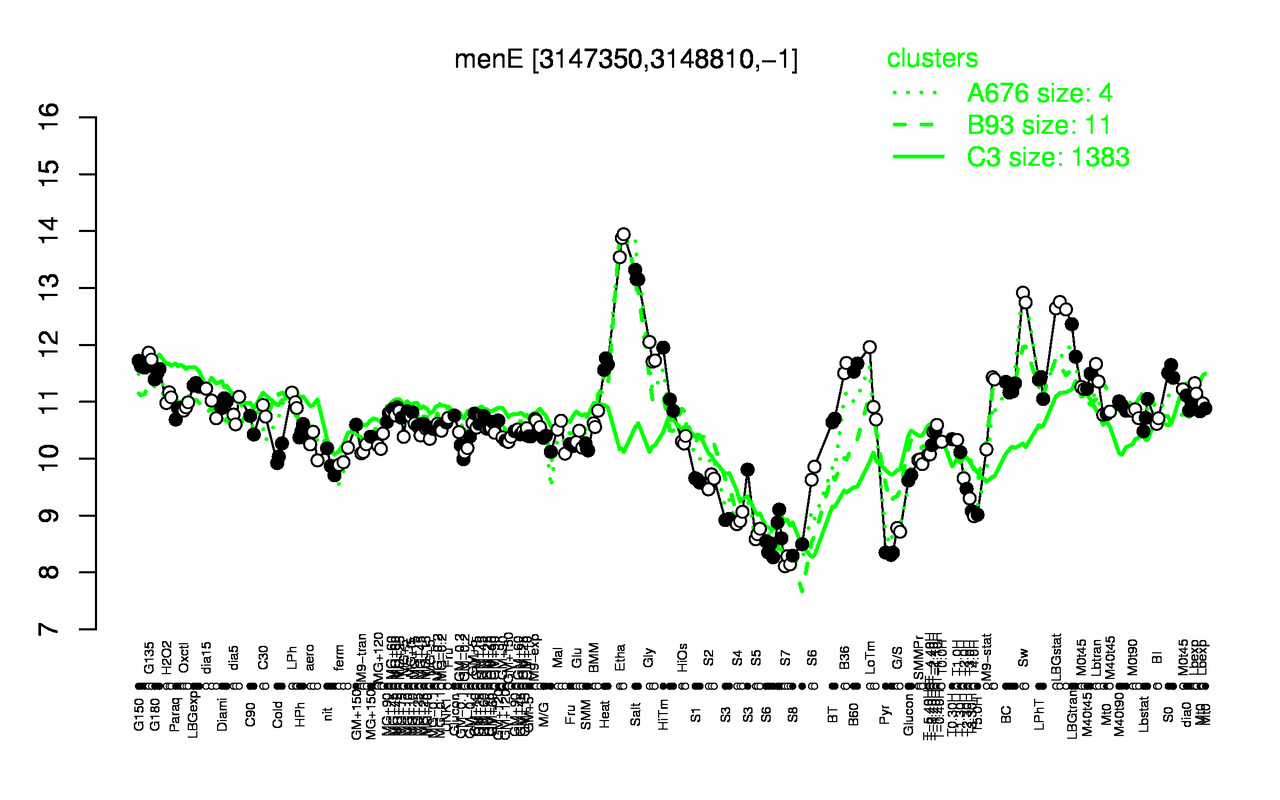
| Etha | Salt | Sw | LBGstat | LBGtran | Gly | G135 | Heat | G150 | B60 |
| 13.8 | 13.2 | 12.8 | 12.7 | 12.1 | 11.8 | 11.8 | 11.7 | 11.6 | 11.6 |
| S7 | Pyr | S8 | S5 | G/S | S6 | S4 | T4.0H | T5.0H | T3.30H |
| 8.18 | 8.33 | 8.39 | 8.67 | 8.75 | 8.86 | 8.94 | 8.99 | 9.01 | 9.08 |