| Start Page |
|
 |
| Start Page |
|
|
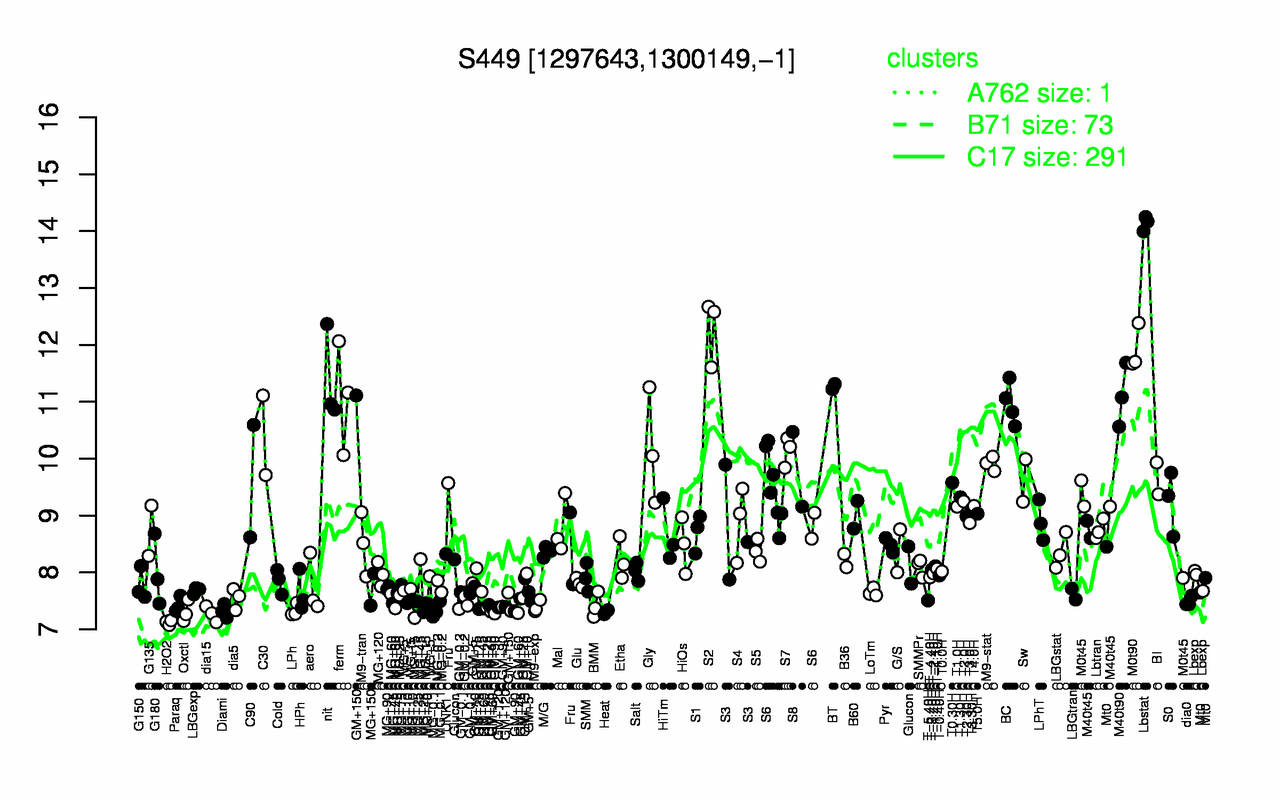
| Lbstat | S2 | M0t90 | nit | BT | M40t90 | ferm | BC | C30 | Gly |
| 14.1 | 12.3 | 11.9 | 11.4 | 11.3 | 11.1 | 11.1 | 11 | 10.4 | 10.2 |
| H2O2 | dia15 | Heat | Oxctl | Diami | GM+90 | LPh | GM+60 | MG-0.1 | GM+120 |
| 7.12 | 7.27 | 7.31 | 7.31 | 7.32 | 7.33 | 7.33 | 7.34 | 7.34 | 7.39 |