| Start Page |
|
 |
| Start Page |
|
|
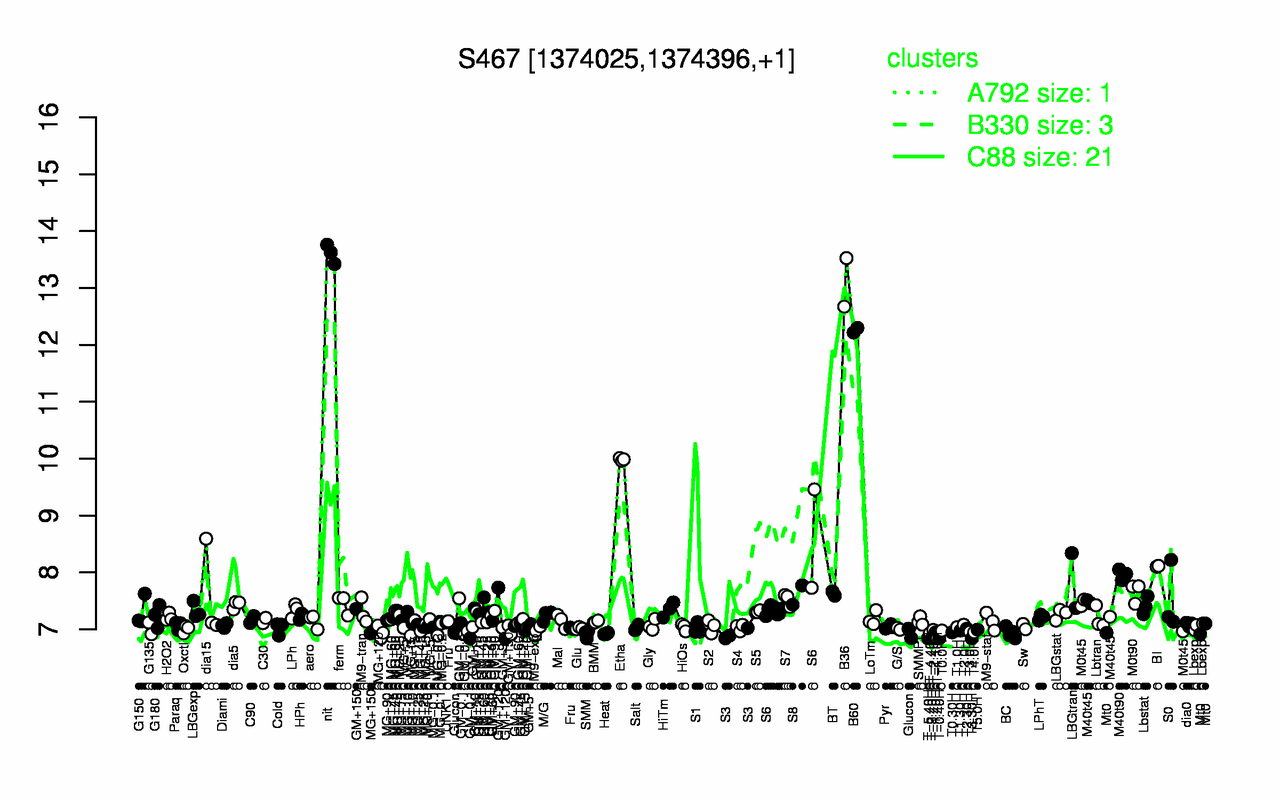
| nit | B36 | B60 | Etha | BI | M40t90 | LBGtran | M0t90 | BT | S6 |
| 13.6 | 13.1 | 12.3 | 9.99 | 8.11 | 7.96 | 7.86 | 7.65 | 7.63 | 7.61 |
| T-1.10H | T-5.40H | T-3.40H | T3.30H | T-0.40H | MG+t5 | S3 | SMM | Heat | Glucon |
| 6.84 | 6.84 | 6.84 | 6.84 | 6.84 | 6.89 | 6.92 | 6.92 | 6.92 | 6.93 |