| Start Page |
|
 |
| Start Page |
|
|
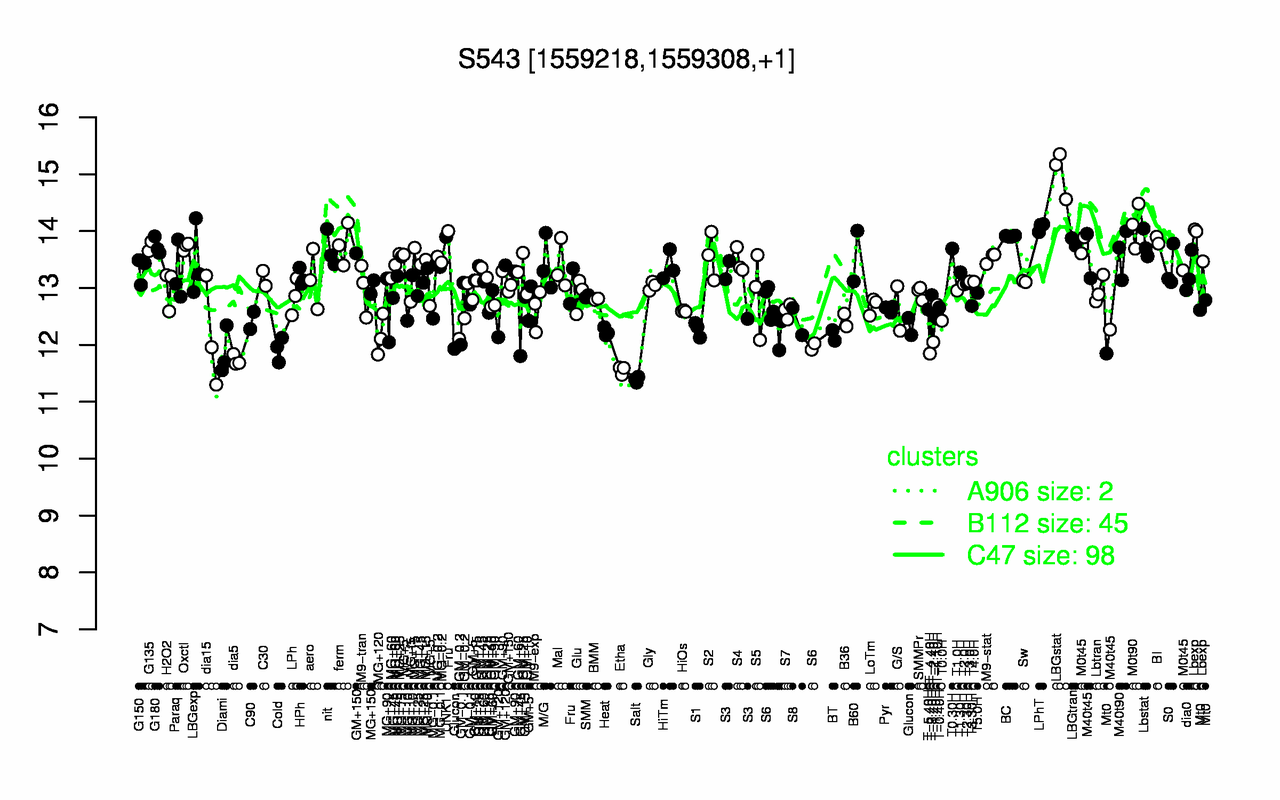
| LBGstat | M0t90 | LPhT | BC | UNK1 | BI | Lbexp | LBGtran | Lbstat | ferm |
| 15 | 14.1 | 14.1 | 13.9 | 13.9 | 13.8 | 13.8 | 13.8 | 13.8 | 13.8 |
| Salt | Etha | dia5 | T-4.40H | Diami | Cold | T-2.40H | dia15 | MG+120 | BT |
| 11.4 | 11.6 | 11.7 | 11.8 | 11.9 | 11.9 | 12 | 12.2 | 12.2 | 12.2 |