| Start Page |
|
 |
| Start Page |
|
|
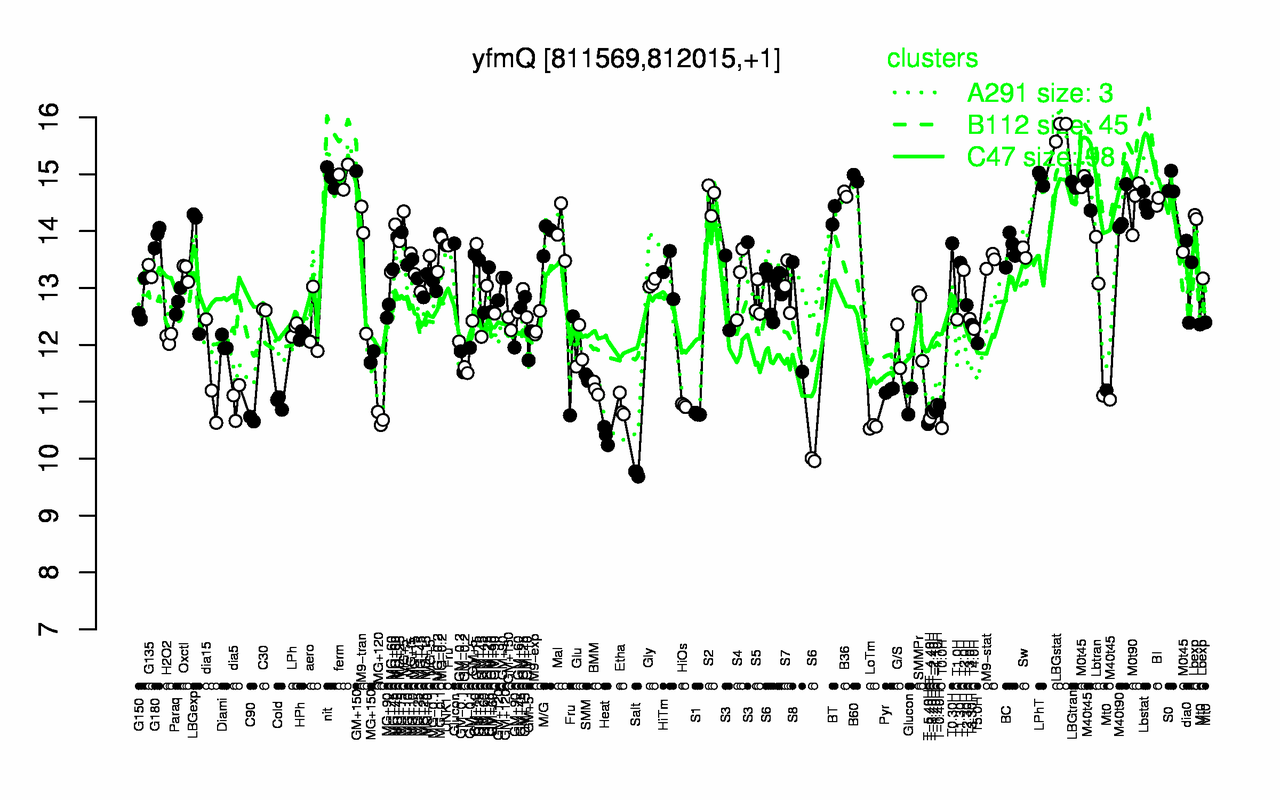
| LBGstat | ferm | nit | LPhT | B60 | S0 | LBGtran | B36 | S2 | BI |
| 15.8 | 15 | 14.9 | 14.9 | 14.9 | 14.8 | 14.8 | 14.7 | 14.6 | 14.5 |
| Salt | Heat | T0.0H | LoTm | T-5.40H | C90 | MG+120 | T-4.40H | S1 | T-2.40H |
| 9.74 | 10.4 | 10.5 | 10.6 | 10.6 | 10.7 | 10.7 | 10.7 | 10.8 | 10.8 |