| Start Page |
|
 |
| Start Page |
|
|
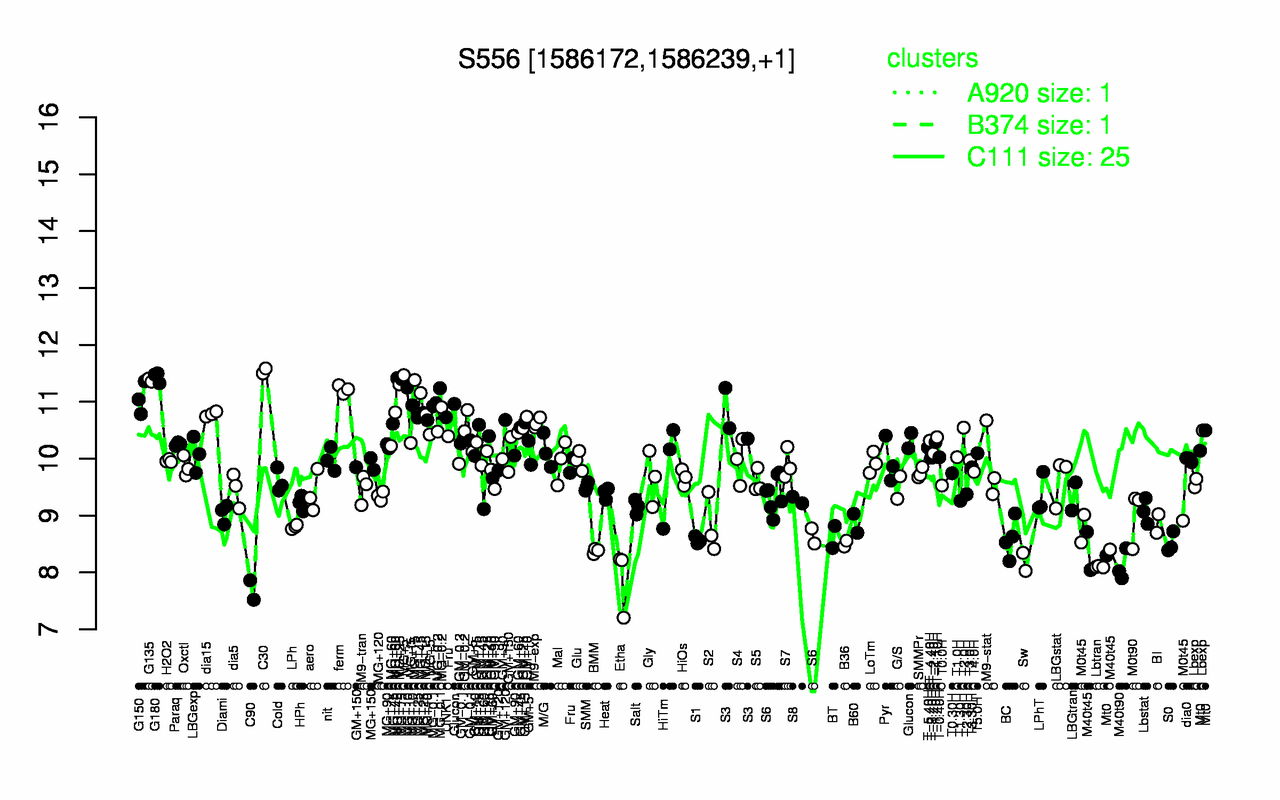
| C30 | G180 | G135 | ferm | MG+15 | G150 | MG+45 | MG-0.1 | MG+10 | MG+5 |
| 11.5 | 11.4 | 11.4 | 11.2 | 11.2 | 11.1 | 11.1 | 11 | 11 | 10.9 |
| C90 | Etha | Lbtran | M40t90 | Sw | BMM | M40t45 | B36 | S0 | S1 |
| 7.69 | 7.88 | 8.1 | 8.12 | 8.19 | 8.38 | 8.39 | 8.51 | 8.52 | 8.57 |