| Start Page |
|
 |
| Start Page |
|
|
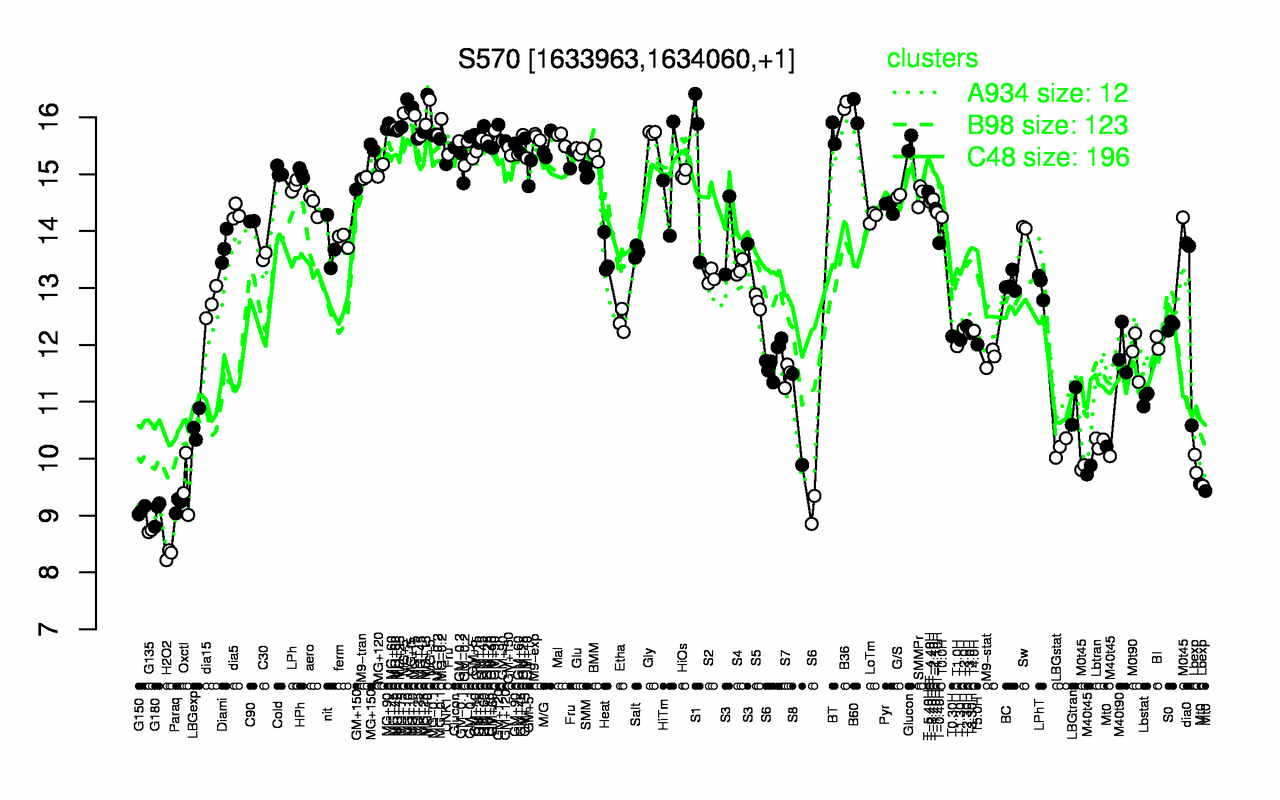
| MG+10 | B36 | MG+5 | MG+t5 | B60 | MG+15 | MG+90 | MG-0.2 | MG+60 | MG+45 |
| 16.3 | 16.2 | 16.2 | 16.1 | 16.1 | 15.9 | 15.8 | 15.8 | 15.8 | 15.7 |
| H2O2 | G135 | G180 | G150 | Paraq | Oxctl | Mt0 | Lbexp | M40t45 | LBGstat |
| 8.32 | 8.73 | 9.06 | 9.09 | 9.19 | 9.5 | 9.73 | 9.78 | 9.88 | 10.2 |