| Start Page |
|
 |
| Start Page |
|
|
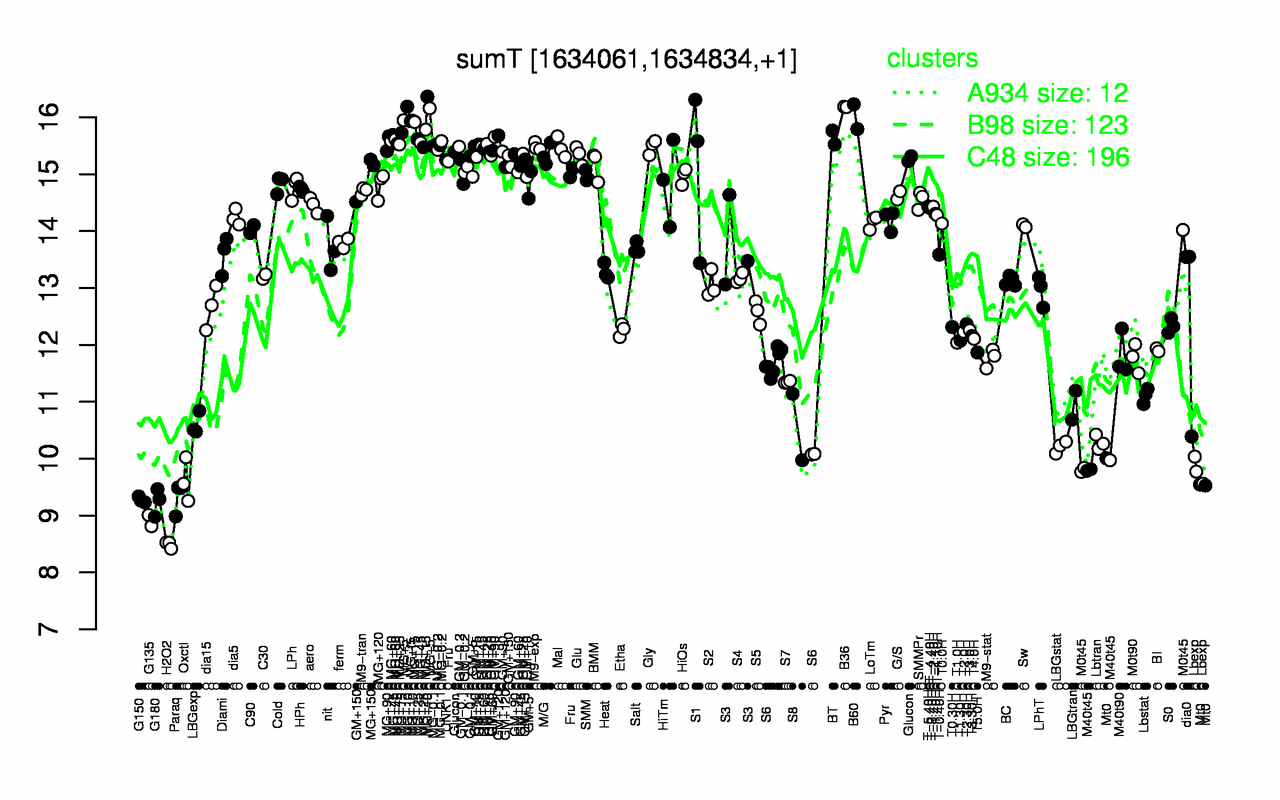
| B36 | MG+10 | MG+5 | B60 | MG+t5 | MG+15 | BT | MG+60 | MG+45 | MG+25 |
| 16.2 | 16.2 | 16.1 | 16 | 15.9 | 15.8 | 15.6 | 15.6 | 15.6 | 15.5 |
| H2O2 | G135 | G180 | G150 | Paraq | Oxctl | Mt0 | Lbexp | M40t45 | LBGstat |
| 8.49 | 8.91 | 9.24 | 9.28 | 9.32 | 9.61 | 9.69 | 9.79 | 9.86 | 10.2 |