B. subtilis Expression Data Browser
Details about S602 Show/Hide
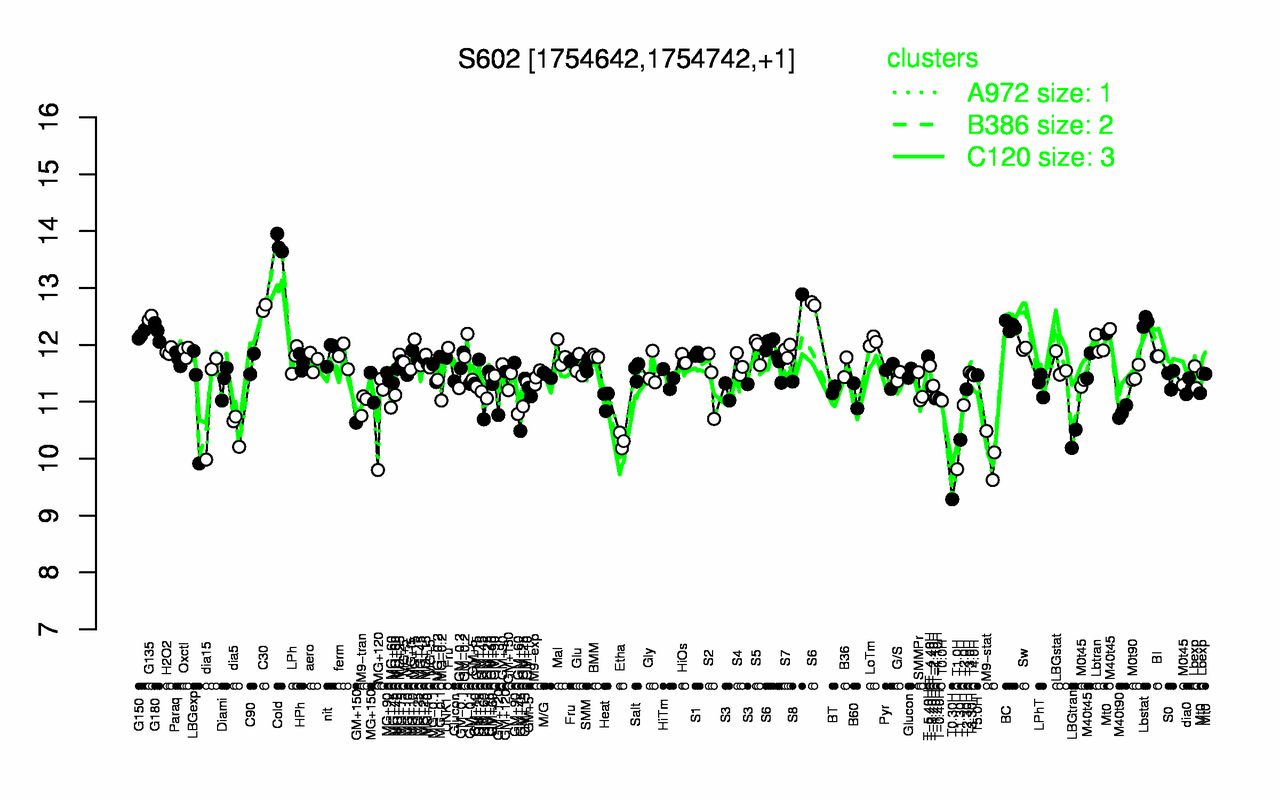
Highest Expression Conditions
Cold C30 G135 Lbstat BC G180 G150 S8 LoTm S6
13.8 12.7 12.5 12.4 12.3 12.2 12.2 12.1 12.1 12
Lowest Expression Conditions
T0.30H T1.0H M9-stat Etha T1.30H LBGtran dia5 MG+120 M40t90 GM+60
9.29 9.81 10.1 10.3 10.3 10.4 10.5 10.8 10.8 10.9
Most Positively Correlated Segments
spoIIIE S181 ytqA yurQ ytqB obg S863 S730 S15 S952
0.76 0.53 0.53 0.52 0.52 0.52 0.51 0.51 0.51 0.5
Most Negatively Correlated Segments
yhjA yttA S697 yozS ykwC ydaF yusH ywbF ymaE yvbK
-0.5 -0.49 -0.46 -0.46 -0.45 -0.44 -0.44 -0.43 -0.42 -0.42
Expression Profile of Segment S602 Show/Hide
Genomic View of Gene/Segment S602 Show/Hide
(Legend)