| Start Page |
|
 |
| Start Page |
|
|
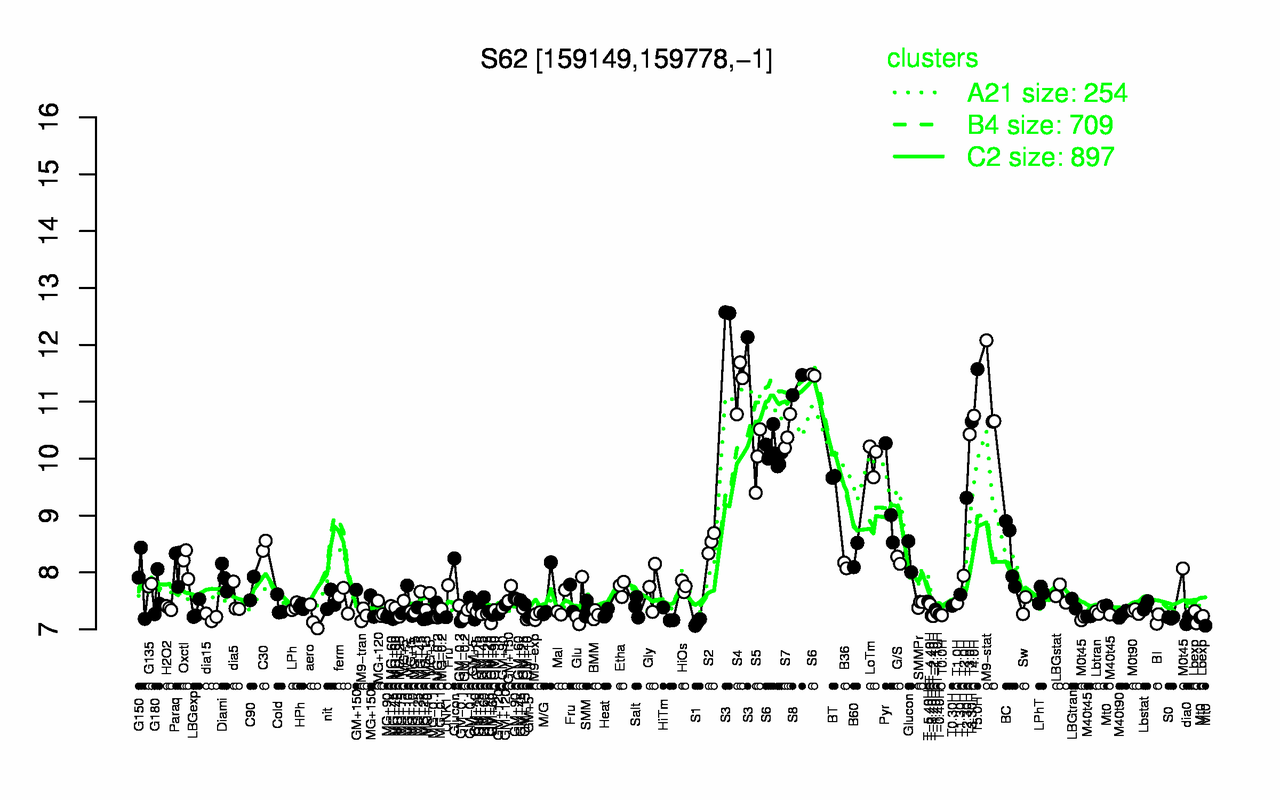
| S3 | T5.0H | S4 | S8 | M9-stat | T4.0H | T3.30H | S7 | T3.0H | S6 |
| 12.4 | 11.6 | 11.3 | 11.3 | 11.1 | 10.8 | 10.7 | 10.4 | 10.4 | 10.4 |
| S1 | dia0 | GM+10 | BI | aero | S0 | dia15 | UNK1 | Lbexp | Mt0 |
| 7.12 | 7.17 | 7.17 | 7.18 | 7.19 | 7.2 | 7.21 | 7.21 | 7.22 | 7.23 |