| Start Page |
|
 |
| Start Page |
|
|
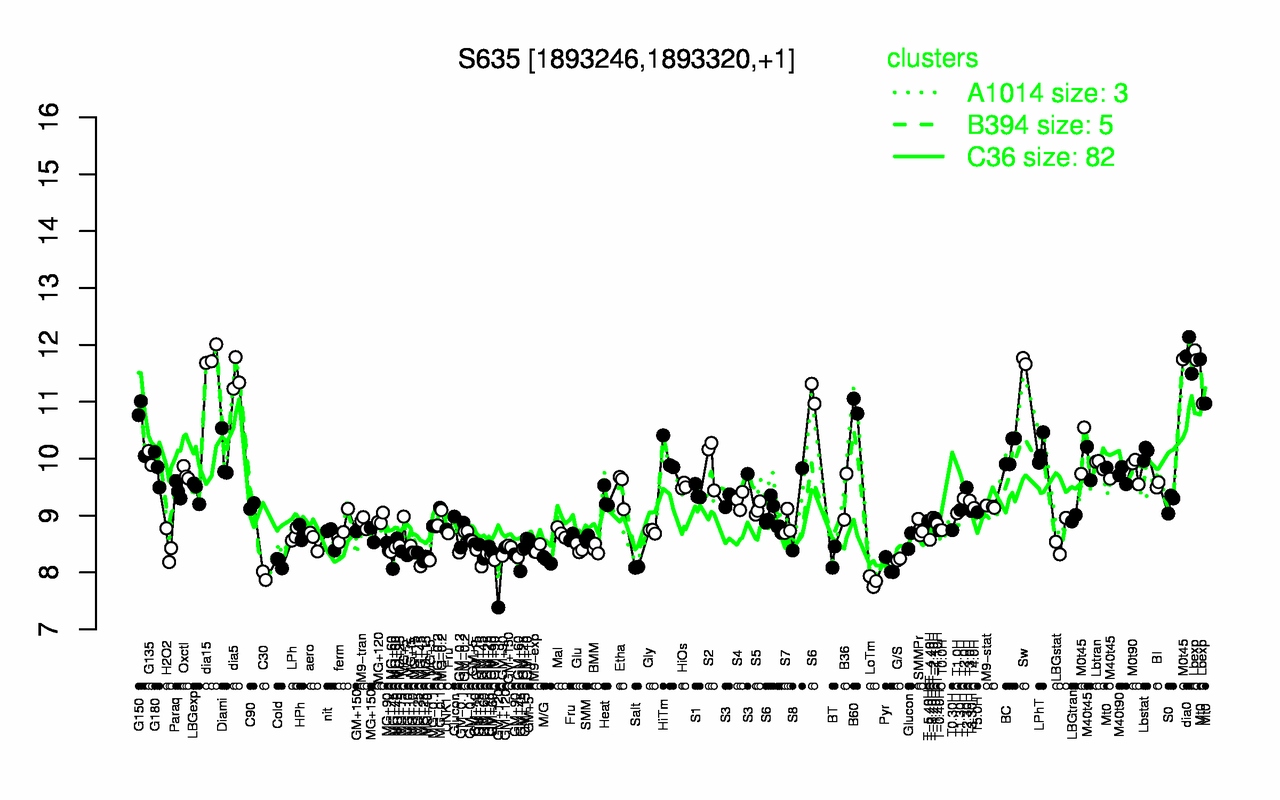
| dia0 | dia15 | Sw | Lbexp | dia5 | B60 | Mt0 | M0t45 | G150 | LPhT |
| 11.8 | 11.8 | 11.7 | 11.5 | 11.5 | 10.9 | 10.9 | 10.7 | 10.6 | 10.1 |
| LoTm | GM+120 | C30 | Salt | Pyr | GM+45 | Cold | M/G | G/S | MG+45 |
| 7.84 | 7.91 | 7.94 | 8.09 | 8.1 | 8.15 | 8.18 | 8.22 | 8.23 | 8.26 |