| Start Page |
|
 |
| Start Page |
|
|
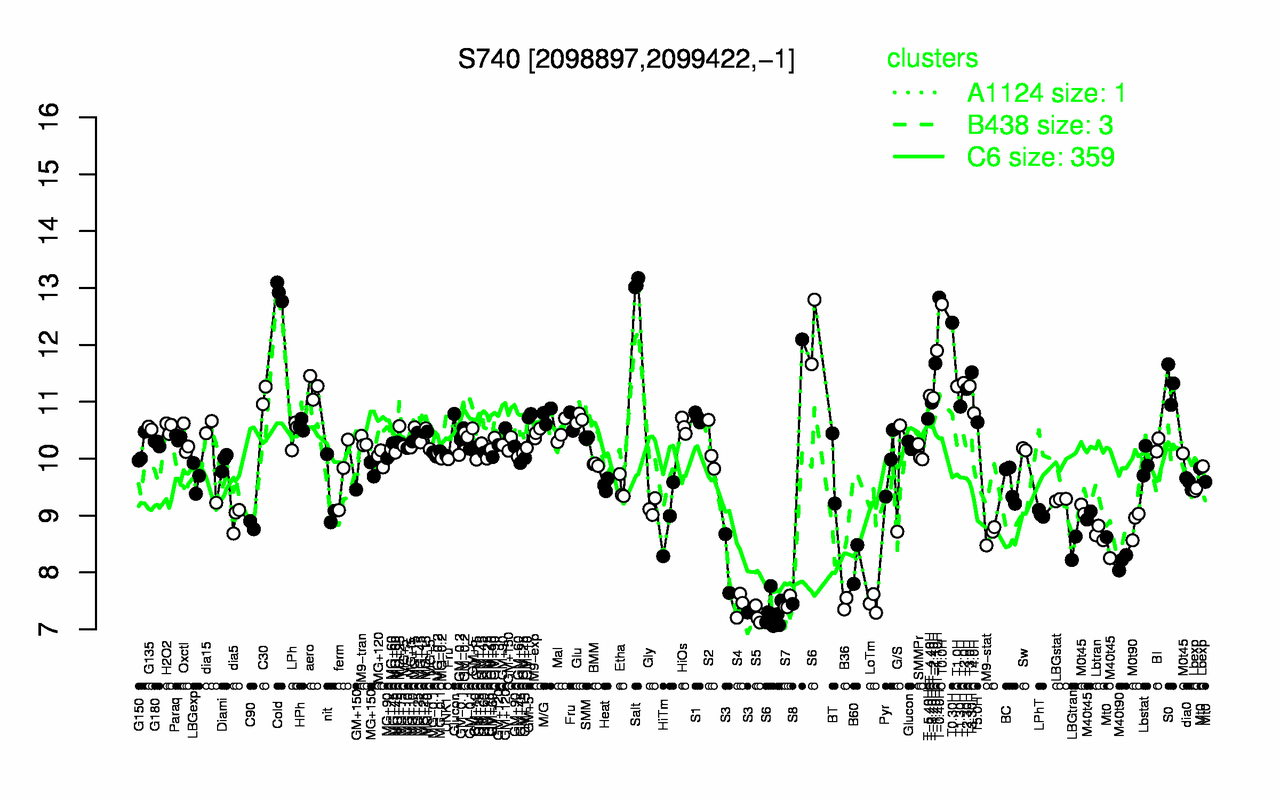
| Salt | Cold | T-0.40H | T0.0H | T0.30H | T-1.10H | T-1.40H | T3.30H | T2.0H | S0 |
| 13.1 | 12.9 | 12.8 | 12.7 | 12.4 | 11.9 | 11.7 | 11.5 | 11.3 | 11.3 |
| S5 | S4 | B36 | LoTm | S7 | S3 | B60 | M40t90 | S6 | LBGtran |
| 7.25 | 7.43 | 7.45 | 7.45 | 7.46 | 7.87 | 8.14 | 8.19 | 8.39 | 8.43 |