| Start Page |
|
 |
| Start Page |
|
|
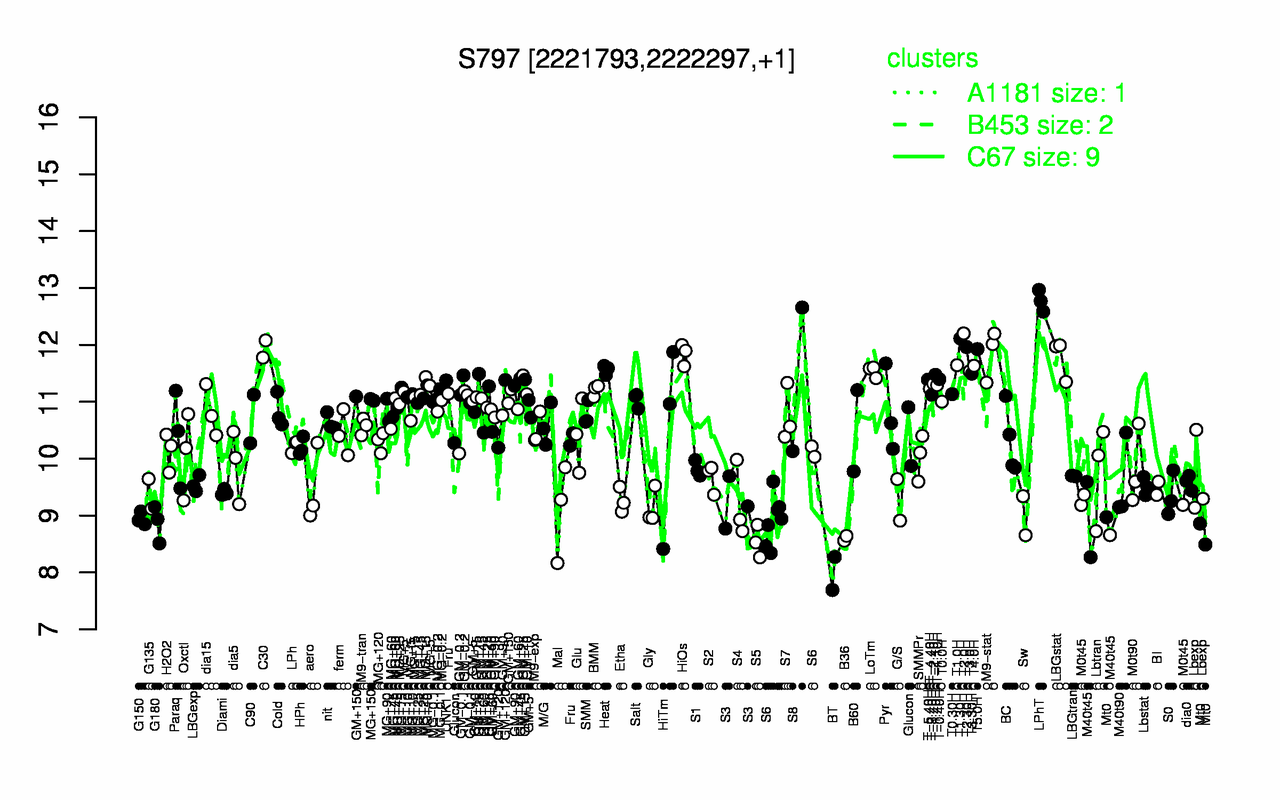
| LPhT | T2.0H | T1.30H | T2.30H | C30 | T5.0H | M9-stat | HiOs | LBGstat | T1.0H |
| 12.8 | 12.2 | 12.1 | 12 | 11.9 | 11.9 | 11.8 | 11.8 | 11.8 | 11.6 |
| BT | S5 | B36 | Mt0 | M40t45 | G180 | G150 | Sw | Mal | Gly |
| 7.98 | 8.54 | 8.6 | 8.77 | 8.84 | 8.87 | 8.94 | 9 | 9.1 | 9.15 |