| Start Page |
|
 |
| Start Page |
|
|
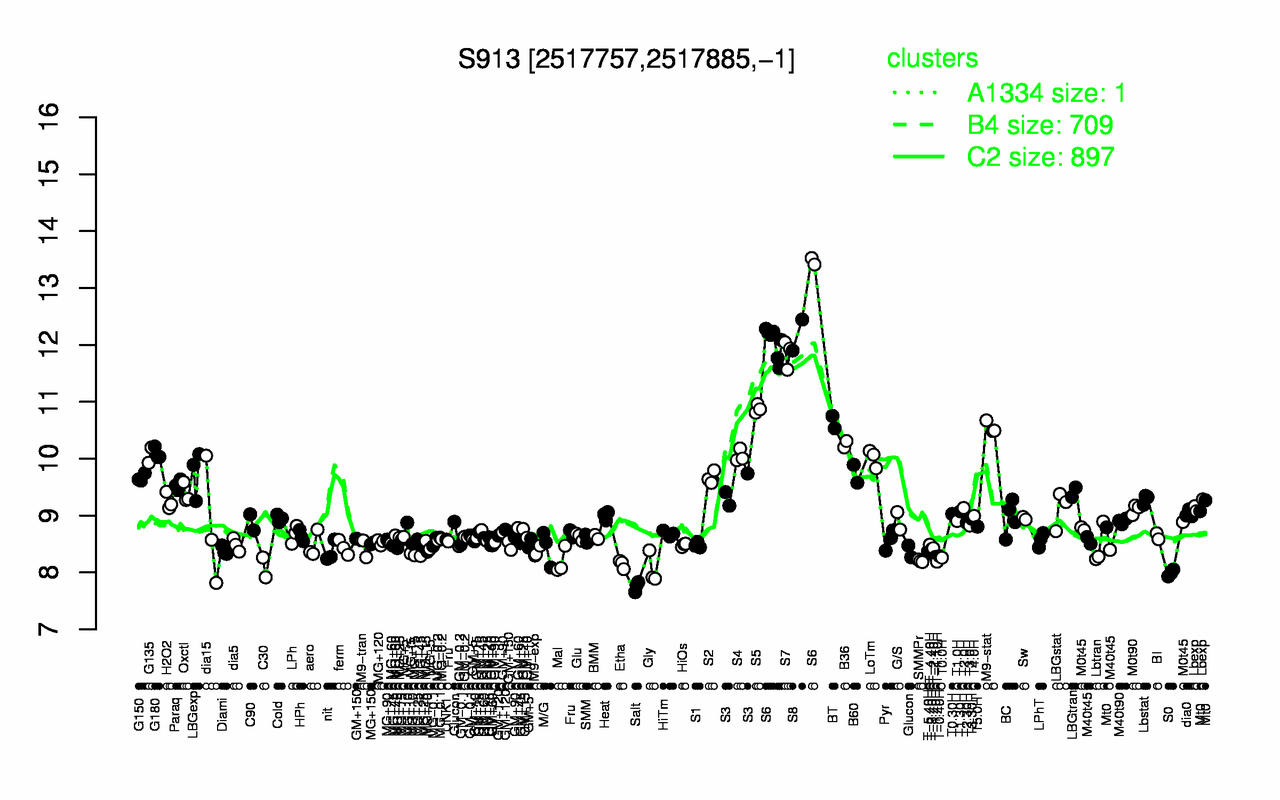
| S6 | S8 | S7 | S5 | BT | M9-stat | B36 | G180 | G135 | S4 |
| 12.4 | 12.2 | 11.8 | 10.9 | 10.6 | 10.6 | 10.3 | 10.1 | 10.1 | 10.1 |
| Salt | S0 | Gly | C30 | Etha | T-1.10H | Mal | SMMPr | T0.0H | T-1.40H |
| 7.75 | 7.99 | 8.06 | 8.09 | 8.14 | 8.19 | 8.2 | 8.2 | 8.26 | 8.28 |