| Start Page |
|
 |
| Start Page |
|
|
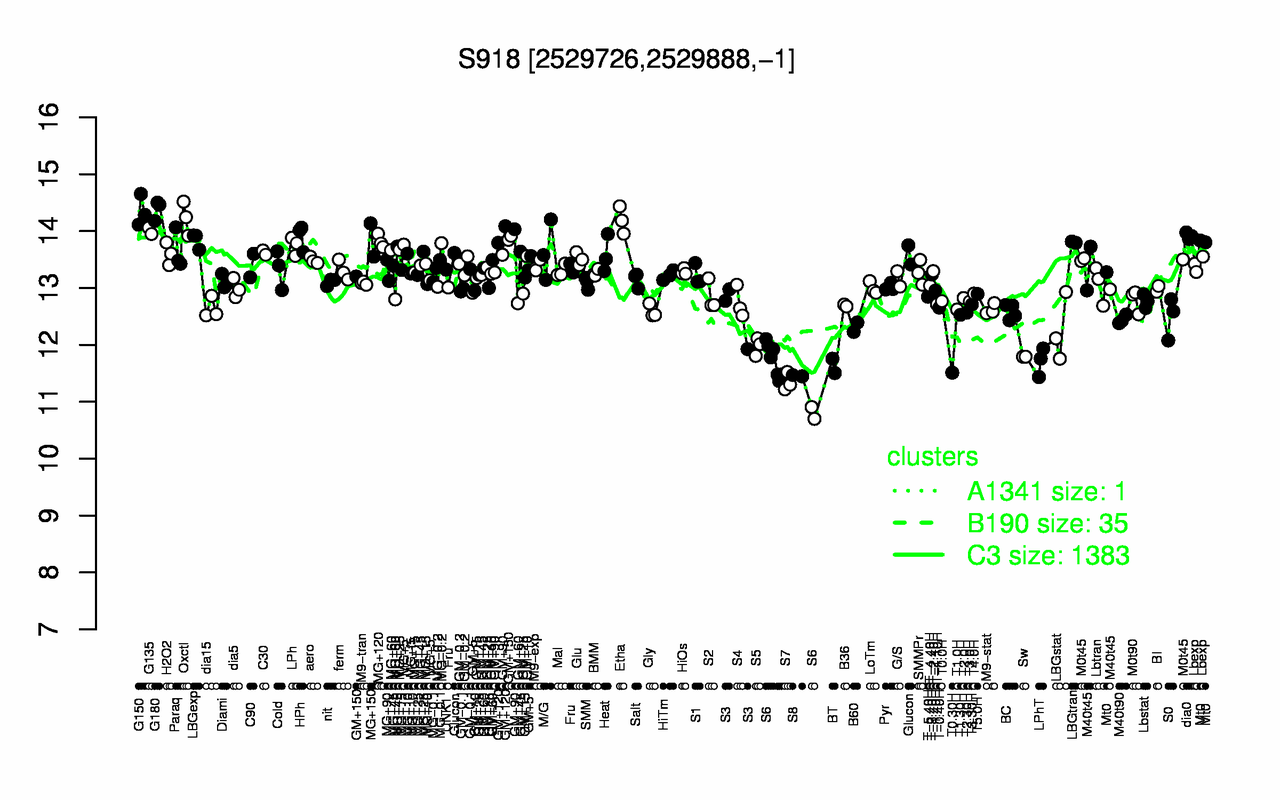
| G180 | G150 | Oxctl | Etha | G135 | GM+120 | dia0 | HPh | MG+150 | LBGexp |
| 14.4 | 14.4 | 14.2 | 14.2 | 14 | 13.9 | 13.9 | 13.9 | 13.8 | 13.8 |
| S7 | S8 | T0.30H | S6 | BT | LPhT | Sw | S5 | LBGstat | B60 |
| 11.3 | 11.5 | 11.5 | 11.5 | 11.6 | 11.7 | 11.8 | 12 | 12.3 | 12.3 |