| Start Page |
|
 |
| Start Page |
|
|
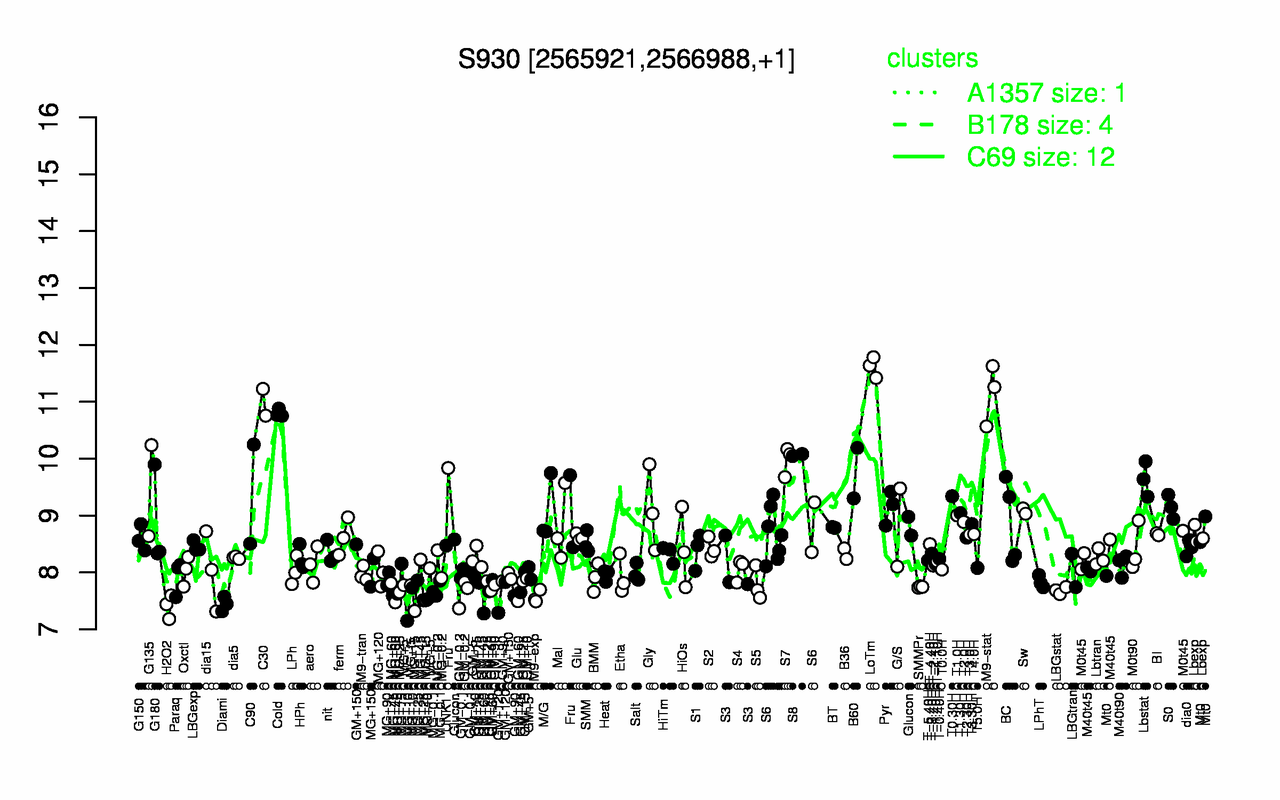
| LoTm | M9-stat | C30 | Cold | S8 | S7 | B60 | Lbstat | G135 | C90 |
| 11.6 | 11.2 | 11 | 10.8 | 10.1 | 9.97 | 9.75 | 9.64 | 9.44 | 9.38 |
| H2O2 | Diami | MG+10 | GM+60 | GM+120 | M9-exp | GM-0.2 | MG+60 | MG+15 | MG+25 |
| 7.41 | 7.45 | 7.47 | 7.55 | 7.56 | 7.57 | 7.64 | 7.64 | 7.66 | 7.67 |