| Start Page |
|
 |
| Start Page |
|
|
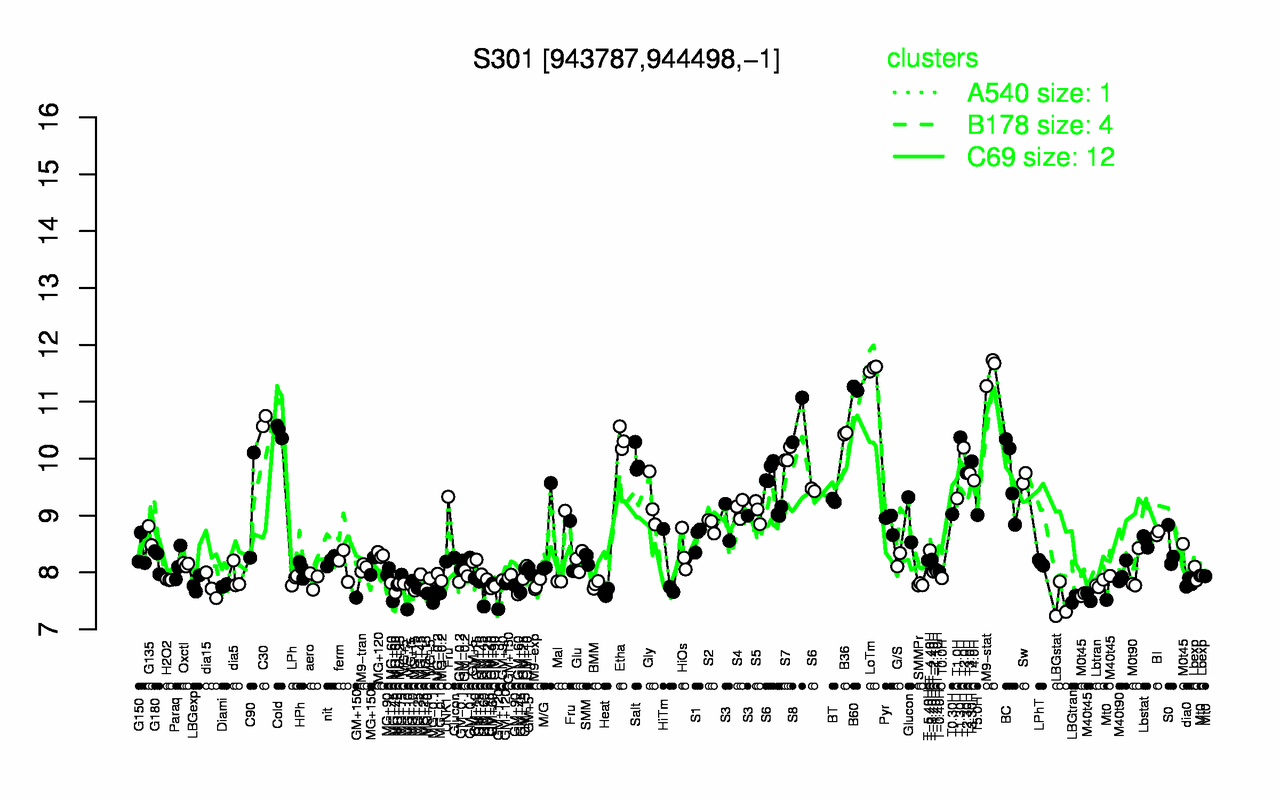
| LoTm | M9-stat | B60 | S8 | C30 | Cold | B36 | T1.30H | Etha | T2.0H |
| 11.6 | 11.6 | 11.2 | 10.7 | 10.7 | 10.5 | 10.4 | 10.4 | 10.3 | 10.2 |
| LBGstat | LBGtran | GM+120 | MG-0.1 | GM+60 | MG+10 | Heat | M40t45 | MG+60 | MG+25 |
| 7.46 | 7.53 | 7.58 | 7.59 | 7.61 | 7.61 | 7.64 | 7.69 | 7.73 | 7.74 |