| Start Page |
|
 |
| Start Page |
|
|
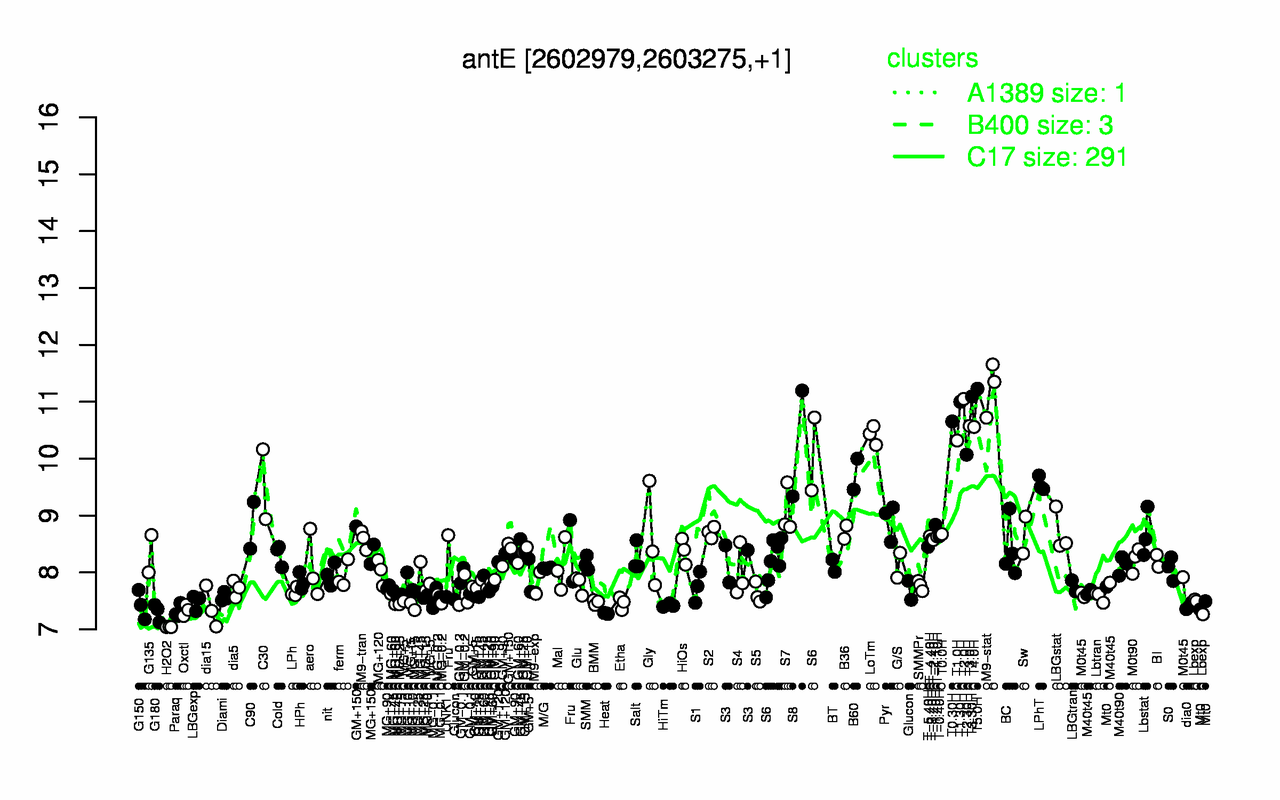
| M9-stat | T5.0H | T3.30H | T2.0H | T1.30H | T0.30H | T3.0H | T4.0H | LoTm | T1.0H |
| 11.2 | 11.2 | 11.1 | 11 | 11 | 10.7 | 10.6 | 10.6 | 10.4 | 10.3 |
| H2O2 | Heat | G180 | Paraq | Oxctl | dia15 | dia0 | HiTm | Lbexp | G150 |
| 7.04 | 7.28 | 7.3 | 7.32 | 7.34 | 7.38 | 7.41 | 7.42 | 7.43 | 7.43 |