| Start Page |
|
 |
| Start Page |
|
|
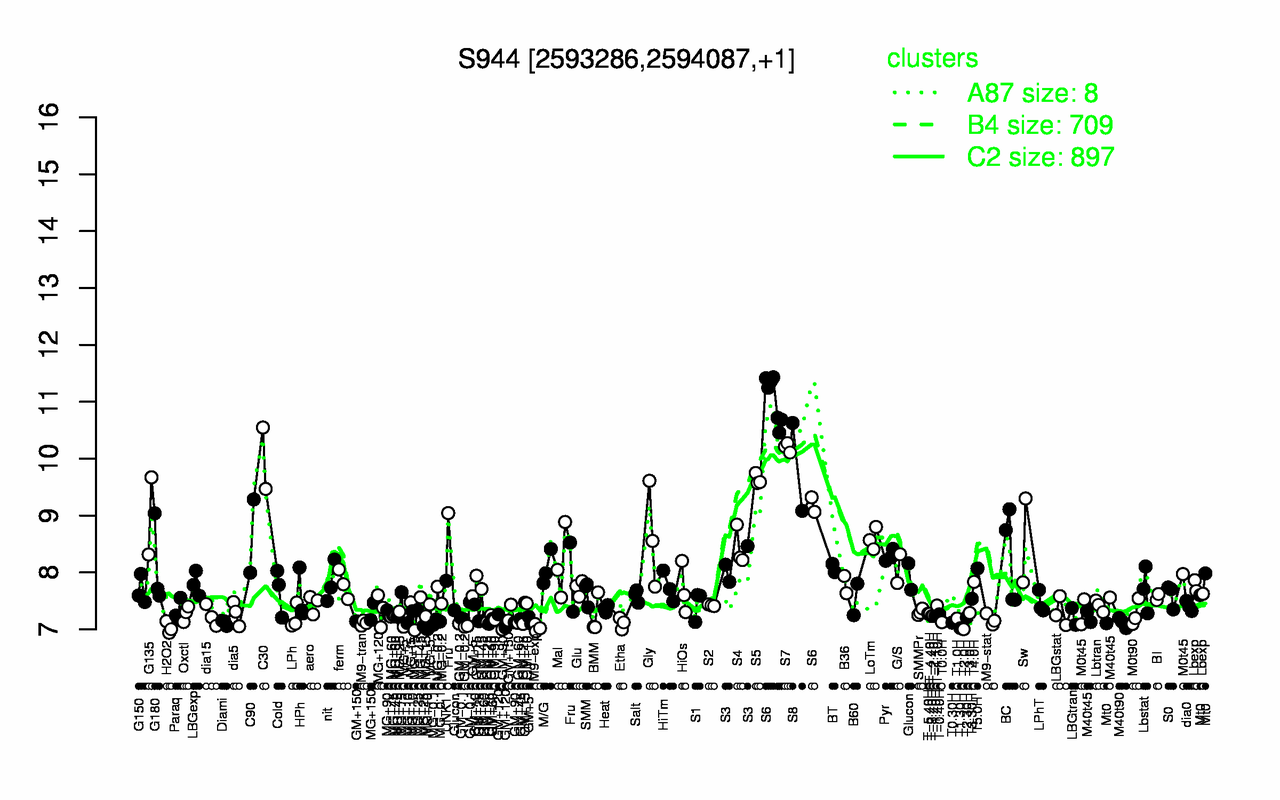
| S6 | S7 | C30 | S8 | S5 | G135 | C90 | Gly | LoTm | Sw |
| 10.6 | 10.2 | 10 | 9.86 | 9.64 | 8.99 | 8.64 | 8.64 | 8.59 | 8.56 |
| T2.0H | T1.30H | M9-exp | H2O2 | GM-0.2 | GM+90 | Etha | M9-tran | Diami | T0.30H |
| 7 | 7.02 | 7.03 | 7.03 | 7.07 | 7.1 | 7.11 | 7.11 | 7.12 | 7.12 |