| Start Page |
|
 |
| Start Page |
|
|
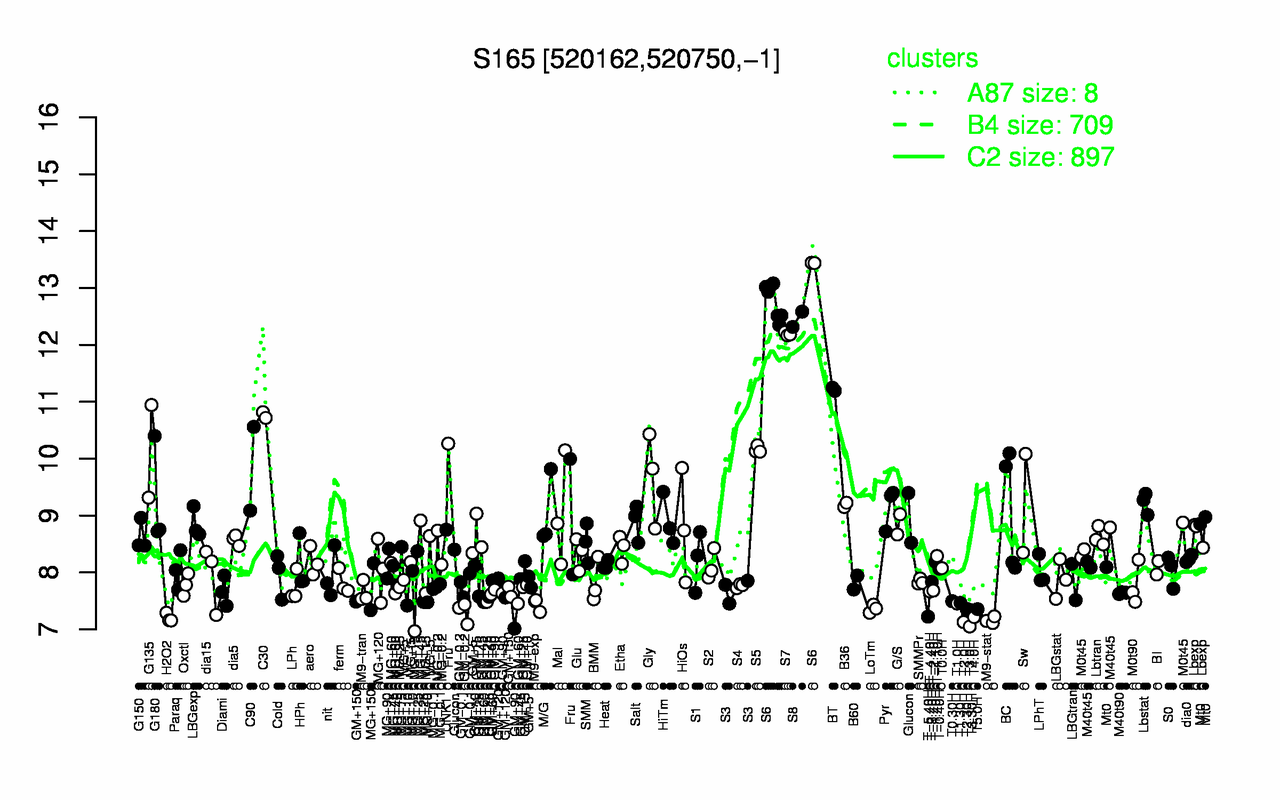
| S6 | S8 | S7 | BT | C30 | S5 | G135 | C90 | Gly | Fru |
| 12.9 | 12.4 | 12.2 | 11.2 | 10.8 | 10.2 | 10.1 | 9.82 | 9.68 | 9.41 |
| T3.0H | T2.0H | M9-stat | H2O2 | T4.0H | T-5.40H | GM-0.2 | T3.30H | T5.0H | T2.30H |
| 7.05 | 7.13 | 7.16 | 7.2 | 7.21 | 7.22 | 7.3 | 7.33 | 7.35 | 7.36 |