| Start Page |
|
 |
| Start Page |
|
|
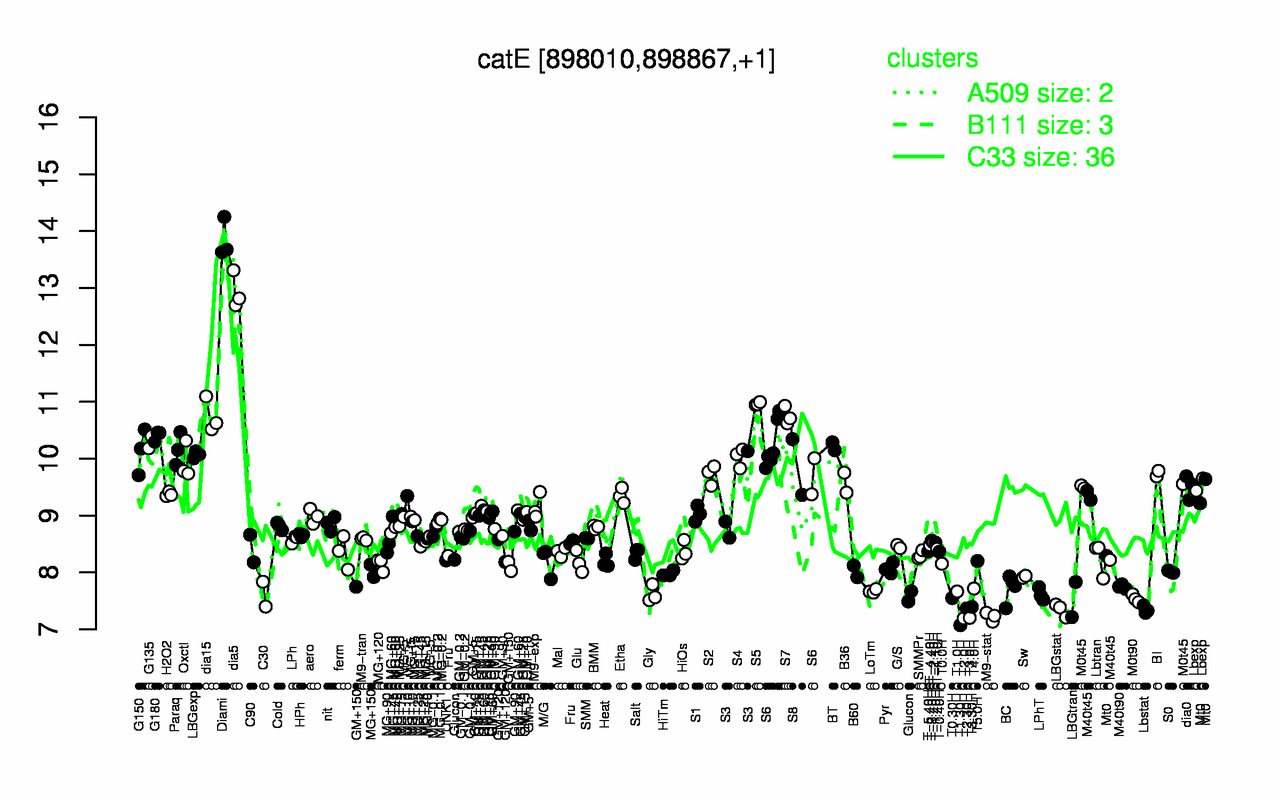
| Diami | dia5 | S5 | S7 | dia15 | G180 | G135 | BT | S6 | Paraq |
| 13.9 | 12.9 | 11 | 10.8 | 10.7 | 10.4 | 10.3 | 10.2 | 10.2 | 10.2 |
| T1.30H | T2.0H | T3.0H | M9-stat | LBGstat | Lbstat | T2.30H | T3.30H | LBGtran | M0t90 |
| 7.07 | 7.19 | 7.2 | 7.22 | 7.34 | 7.35 | 7.37 | 7.39 | 7.52 | 7.54 |