B. subtilis Expression Data Browser
Details about cotU Show/Hide
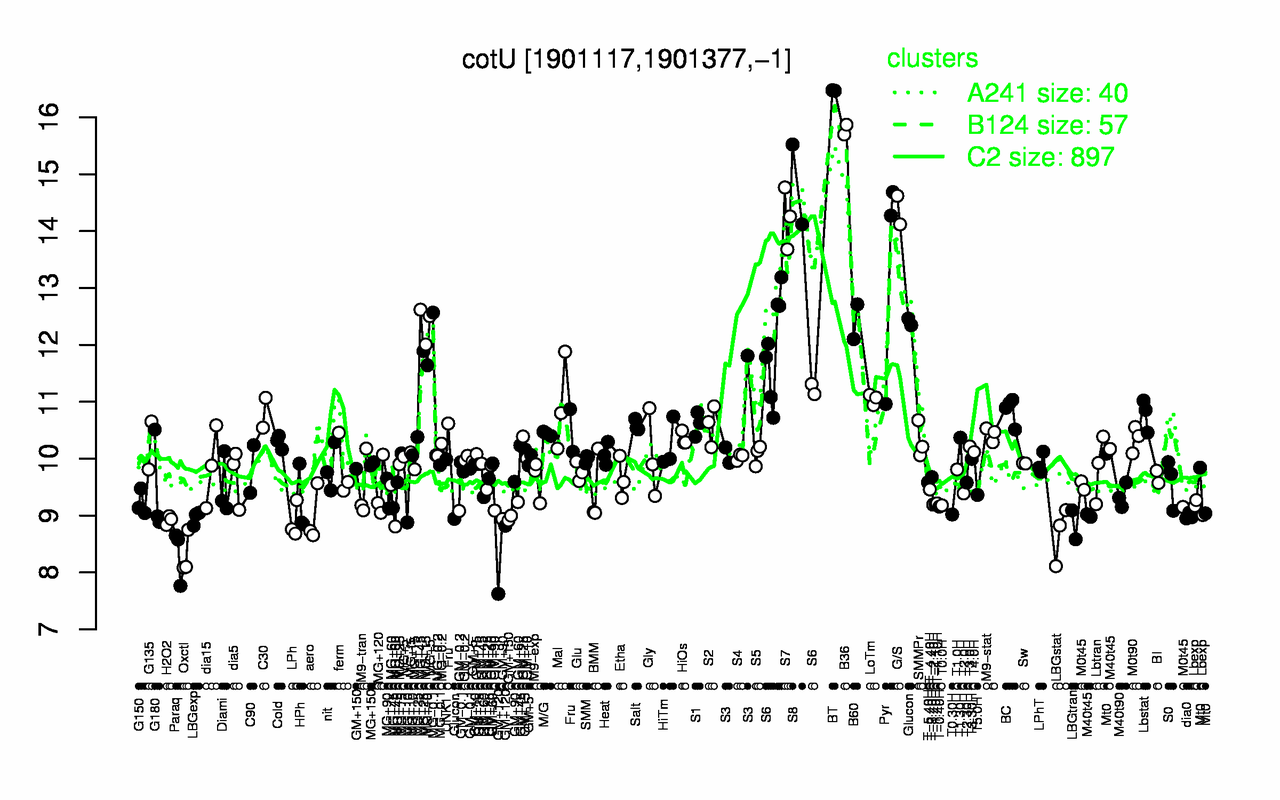
Highest Expression Conditions
BT B36 S8 G/S S7 Pyr B60 S6 MG+5 Glucon
16.5 15.8 14.8 14.4 14.2 13.3 12.4 11.8 11.3 11.2
Lowest Expression Conditions
GM+120 Oxctl Paraq LBGstat LBGtran LPh H2O2 LBGexp aero dia0
8.22 8.31 8.33 8.68 8.84 8.9 8.92 8.96 8.98 8.99
Most Positively Correlated Segments
ypzD yosA S771 S665 yurS yczM cgeC ypqP ywrK sspG
0.89 0.88 0.88 0.88 0.86 0.86 0.85 0.85 0.84 0.84
Most Negatively Correlated Segments
yfjM yvcP ydhC yufL ycbL yxjN yrrL yokF mprF ydeM
-0.68 -0.68 -0.68 -0.67 -0.67 -0.65 -0.65 -0.65 -0.65 -0.65
Expression Profile of Segment cotU Show/Hide
Annotation of Gene cotU Show/Hide
function
16.8: Protect
function
16.13: Shape
function
16.5: Explore
inference
ab initio prediction:AMIGene:2.0
codon_start
1
product
spore coat protein
transl_table
11
note
Evidence 1a: Function experimentally demonstrated in the studied strain; PubMedId: 12562816, 18065538; Product type f: factor
db_xref
GI:2634151
protein_id
CAB13651.1
Genomic View of Gene/Segment cotU Show/Hide
(Legend)