| Start Page |
|
 |
| Start Page |
|
|
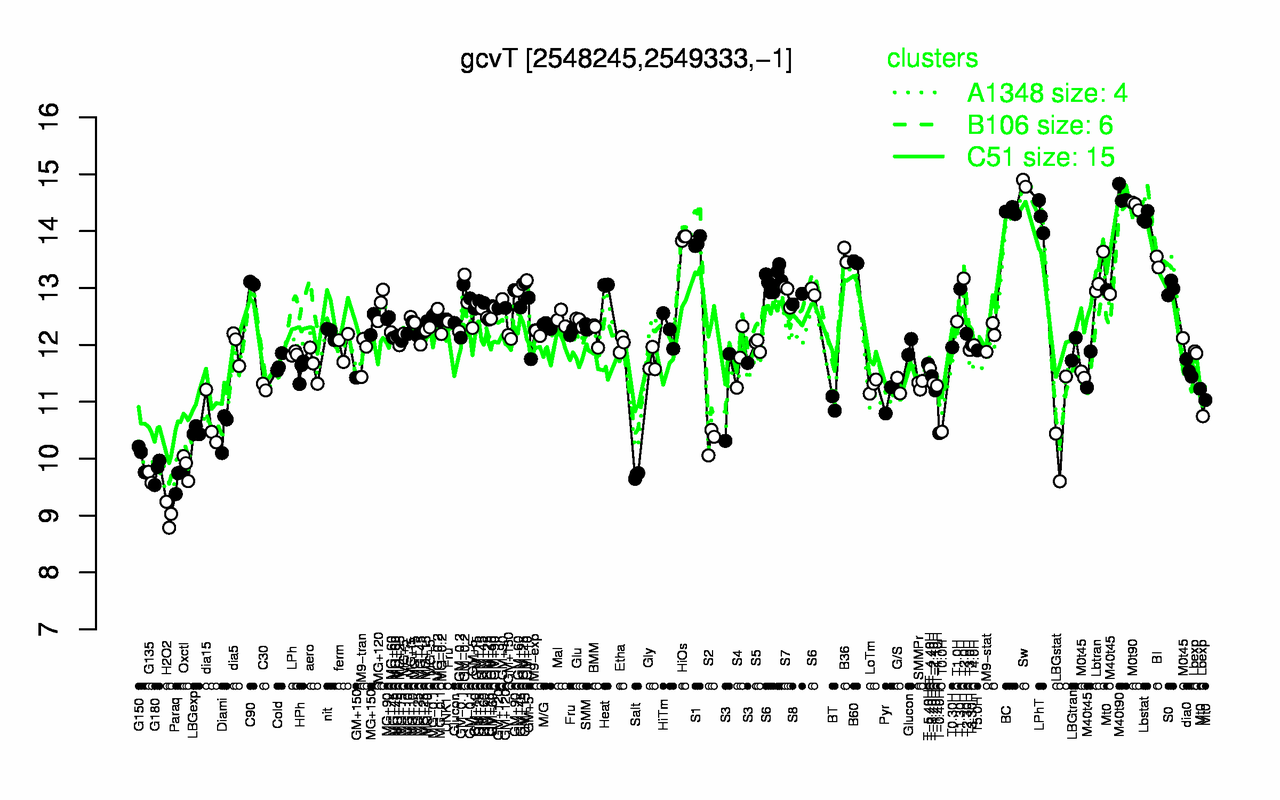
| Sw | M40t90 | M0t90 | BC | LPhT | Lbstat | HiOs | S1 | B36 | BI |
| 14.8 | 14.6 | 14.4 | 14.4 | 14.3 | 14.2 | 13.9 | 13.8 | 13.6 | 13.5 |
| H2O2 | Paraq | G135 | Salt | G180 | Oxctl | G150 | S2 | T-0.40H | T0.0H |
| 9.02 | 9.63 | 9.67 | 9.7 | 9.78 | 9.86 | 10 | 10.3 | 10.4 | 10.5 |