| Start Page |
|
 |
| Start Page |
|
|
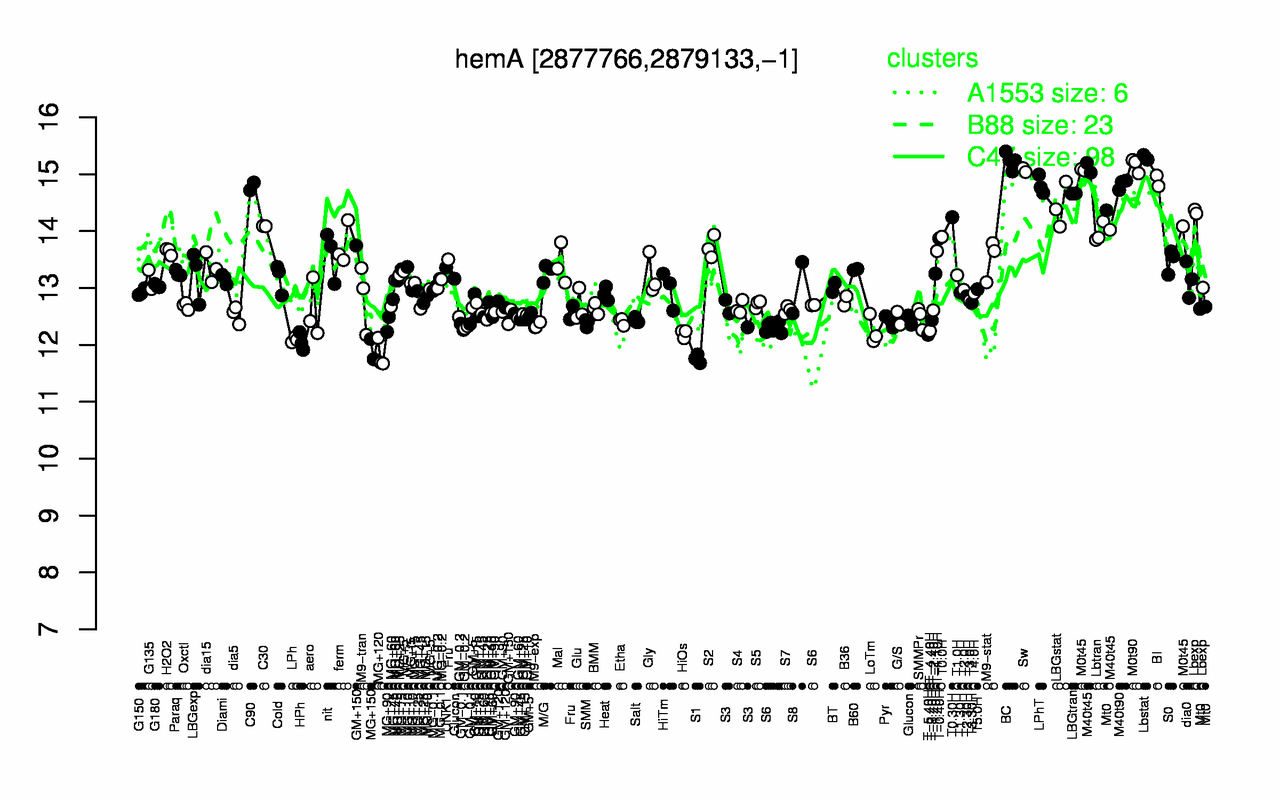
| Lbstat | BC | M0t90 | Sw | BI | M40t90 | LPhT | C90 | M40t45 | M0t45 |
| 15.3 | 15.2 | 15.2 | 15.1 | 14.9 | 14.8 | 14.8 | 14.8 | 14.7 | 14.7 |
| S1 | MG+120 | MG+150 | HPh | LPh | T-5.40H | HiOs | T-4.40H | LoTm | GM-0.1 |
| 11.8 | 11.8 | 11.9 | 12.1 | 12.1 | 12.2 | 12.2 | 12.2 | 12.3 | 12.3 |