| Start Page |
|
 |
| Start Page |
|
|
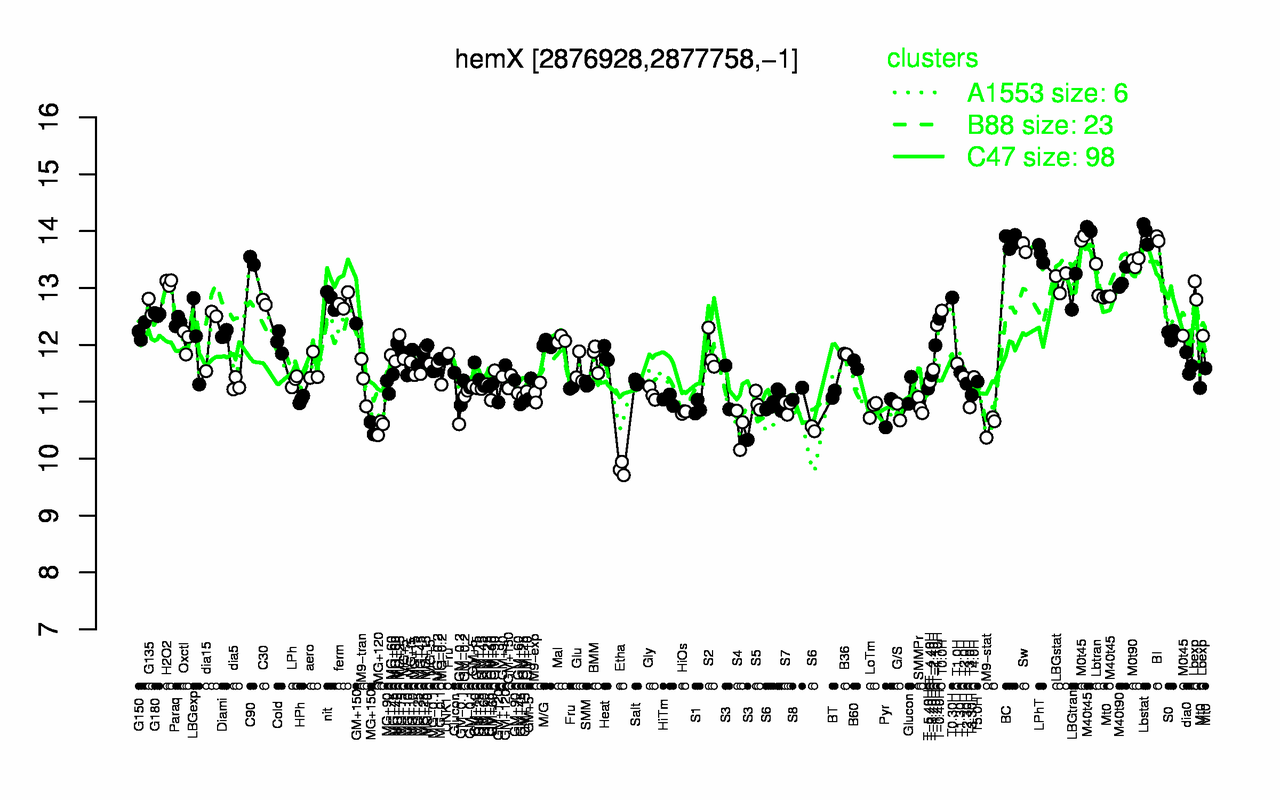
| Lbstat | BI | BC | Sw | M40t45 | LPhT | C90 | M0t90 | M0t45 | M40t90 |
| 14 | 13.9 | 13.8 | 13.7 | 13.6 | 13.6 | 13.5 | 13.5 | 13.3 | 13.2 |
| Etha | MG+150 | S4 | MG+120 | M9-stat | HiOs | G/S | Pyr | LoTm | S6 |
| 9.82 | 10.5 | 10.5 | 10.6 | 10.6 | 10.8 | 10.8 | 10.9 | 10.9 | 10.9 |