B. subtilis Expression Data Browser
Start Page
B. subtilis Expression Data Browser
Gene/Segment:
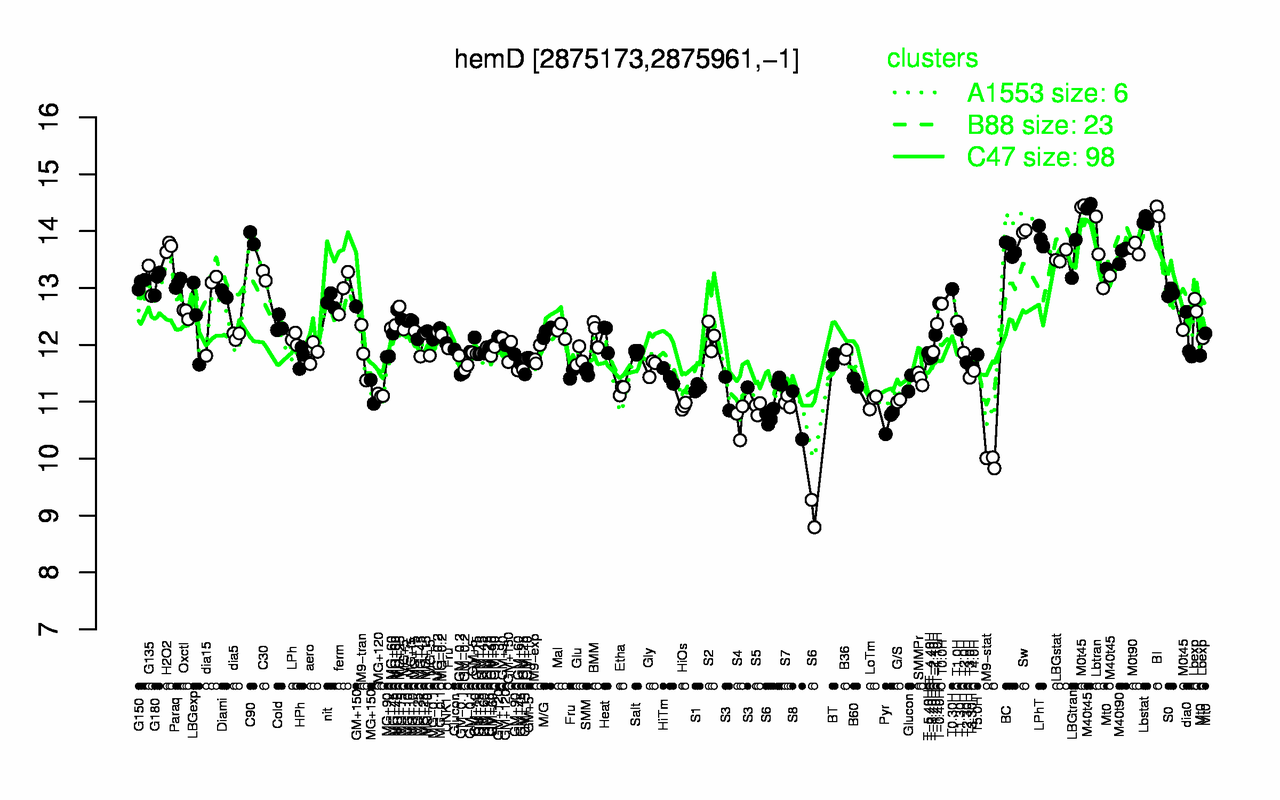
hemD
Locus Tag:
BSU28140
Details about hemD
Show/Hide
Highest Expression Conditions
BI
Lbstat
M40t45
Sw
LPhT
C90
H2O2
M0t45
M0t90
BC
14.3
14.2
14
14
13.9
13.9
13.7
13.7
13.7
13.7
Lowest Expression Conditions
M9-stat
S6
Pyr
S4
S8
S5
HiOs
S7
LoTm
G/S
9.95
10.6
10.7
10.7
10.8
10.9
10.9
11
11
11
Most Positively Correlated Segments
hemB
hemC
hemL
hemX
whiA
crh
yvcK
yvcN
hemA
ecsC
0.98
0.96
0.95
0.93
0.82
0.81
0.8
0.8
0.77
0.77
Most Negatively Correlated Segments
safA
proH
S92
S1055
S1056
ylmC
proJ
ykwB
ilvE
yuiC
-0.73
-0.72
-0.72
-0.71
-0.71
-0.71
-0.7
-0.68
-0.68
-0.67
Expression Profile of Segment hemD
Show/Hide
Annotation of Gene hemD
Show/Hide
function
16.2: Construct biomass (Anabolism)
inference
ab initio prediction:AMIGene:2.0
codon_start
1
EC_number
4.2.1.75
transl_table
11
note
Evidence 1a: Function experimentally demonstrated in the studied strain; PubMedId: 12029044, 15802251, 2110138; Product type e: enzyme
db_xref
GI:2635279
product
uroporphyrinogen III cosynthase
protein_id
CAB14774.1
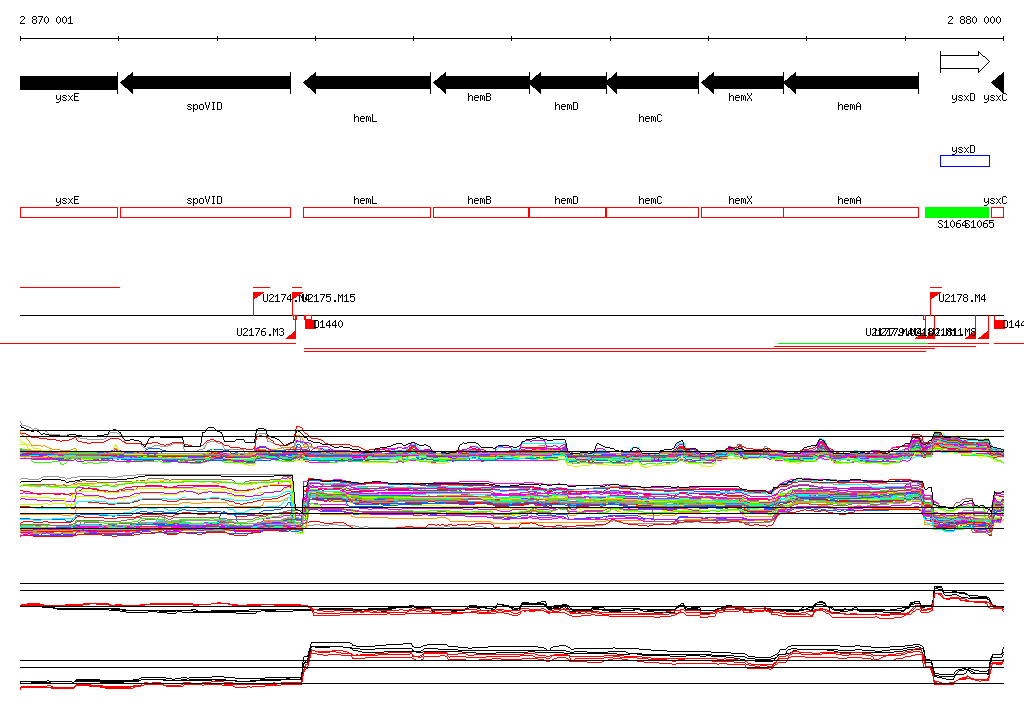
Genomic View of Gene/Segment hemD
Show/Hide
(Legend)
Browse Genome Context