| Start Page |
|
 |
| Start Page |
|
|
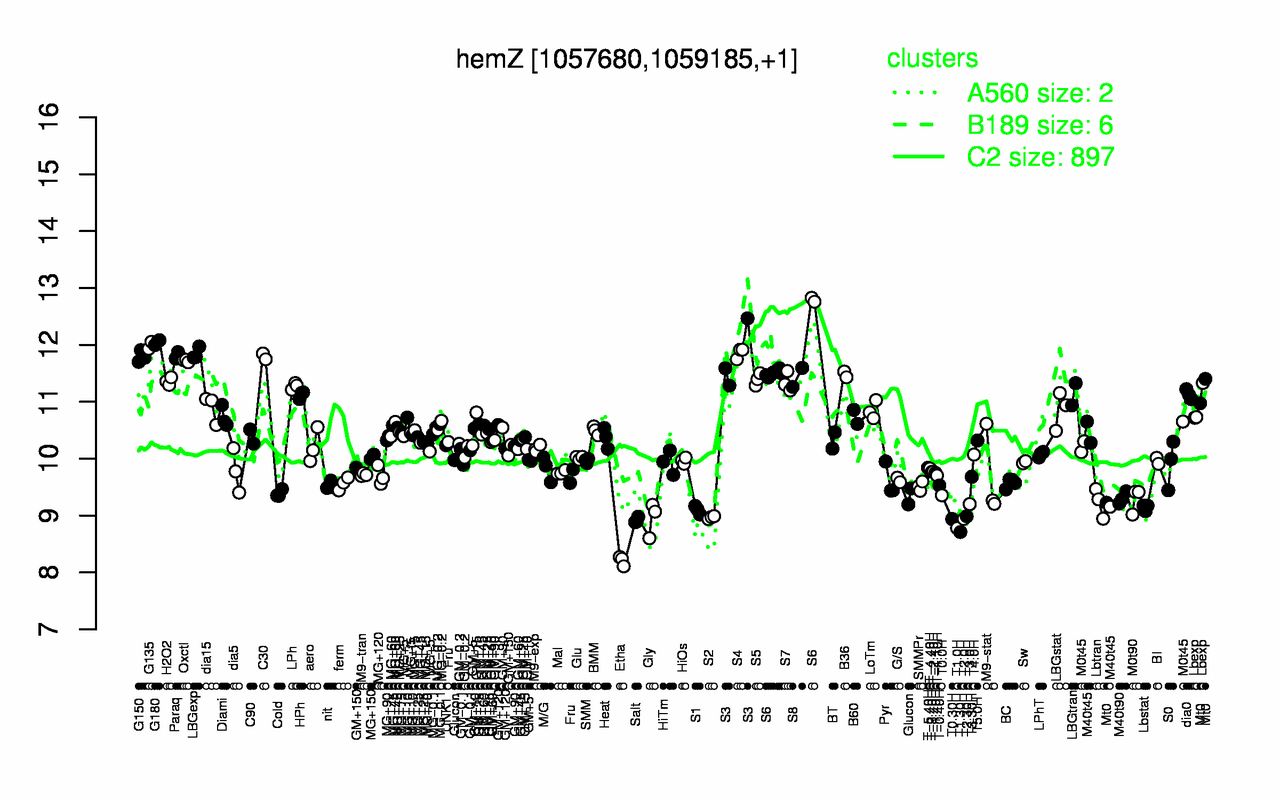
| G180 | G135 | S4 | LBGexp | Paraq | C30 | G150 | S6 | S3 | Oxctl |
| 12 | 12 | 11.9 | 11.8 | 11.8 | 11.8 | 11.8 | 11.8 | 11.8 | 11.7 |
| Etha | T1.30H | T1.0H | Salt | T0.30H | T2.0H | Gly | S2 | T2.30H | S1 |
| 8.21 | 8.71 | 8.78 | 8.92 | 8.94 | 8.94 | 8.95 | 8.97 | 8.99 | 9.1 |