| Start Page |
|
 |
| Start Page |
|
|
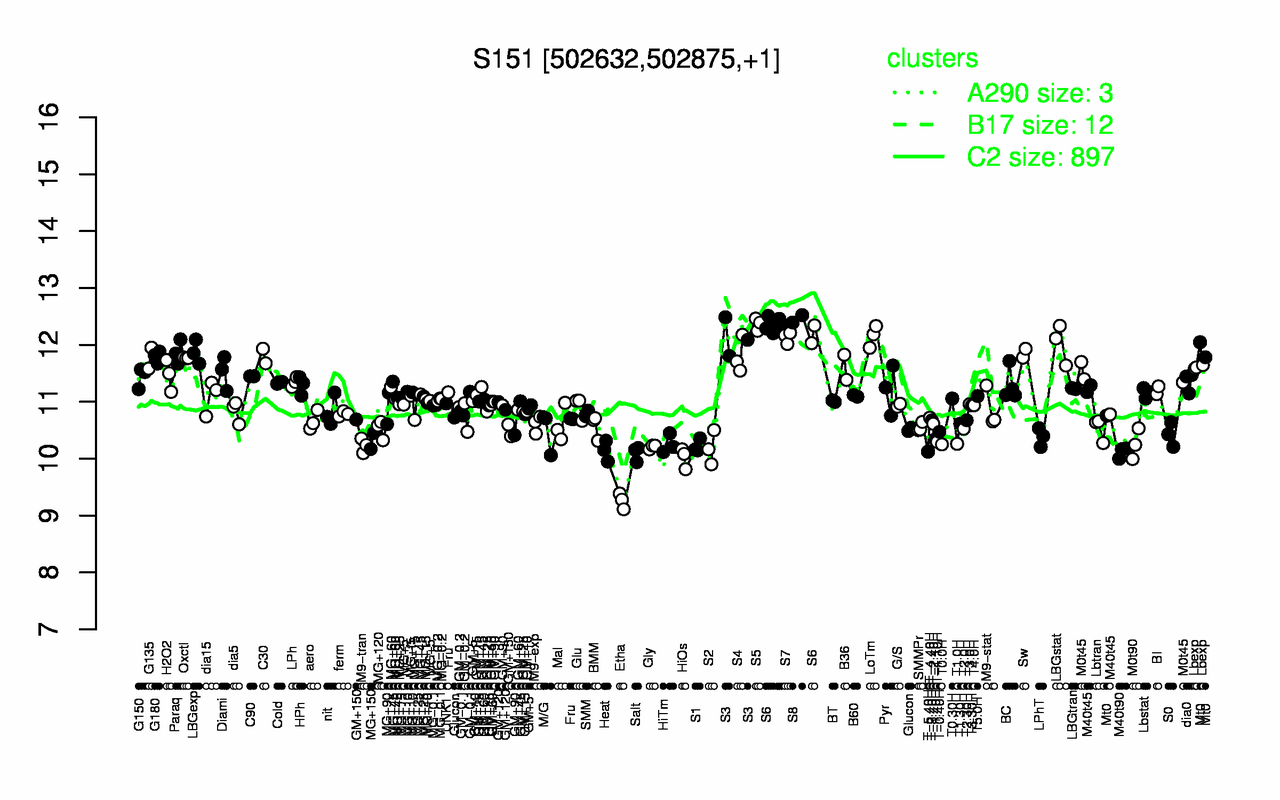
| S8 | S5 | S6 | LoTm | S7 | S3 | LBGstat | LBGexp | Paraq | Sw |
| 12.5 | 12.4 | 12.3 | 12.2 | 12.1 | 12.1 | 12 | 11.9 | 11.9 | 11.9 |
| Etha | HiOs | Salt | M40t90 | T-5.40H | Heat | S2 | Gly | S1 | M9-tran |
| 9.26 | 10 | 10.1 | 10.1 | 10.1 | 10.1 | 10.2 | 10.2 | 10.2 | 10.2 |