B. subtilis Expression Data Browser
Details about hprT Show/Hide
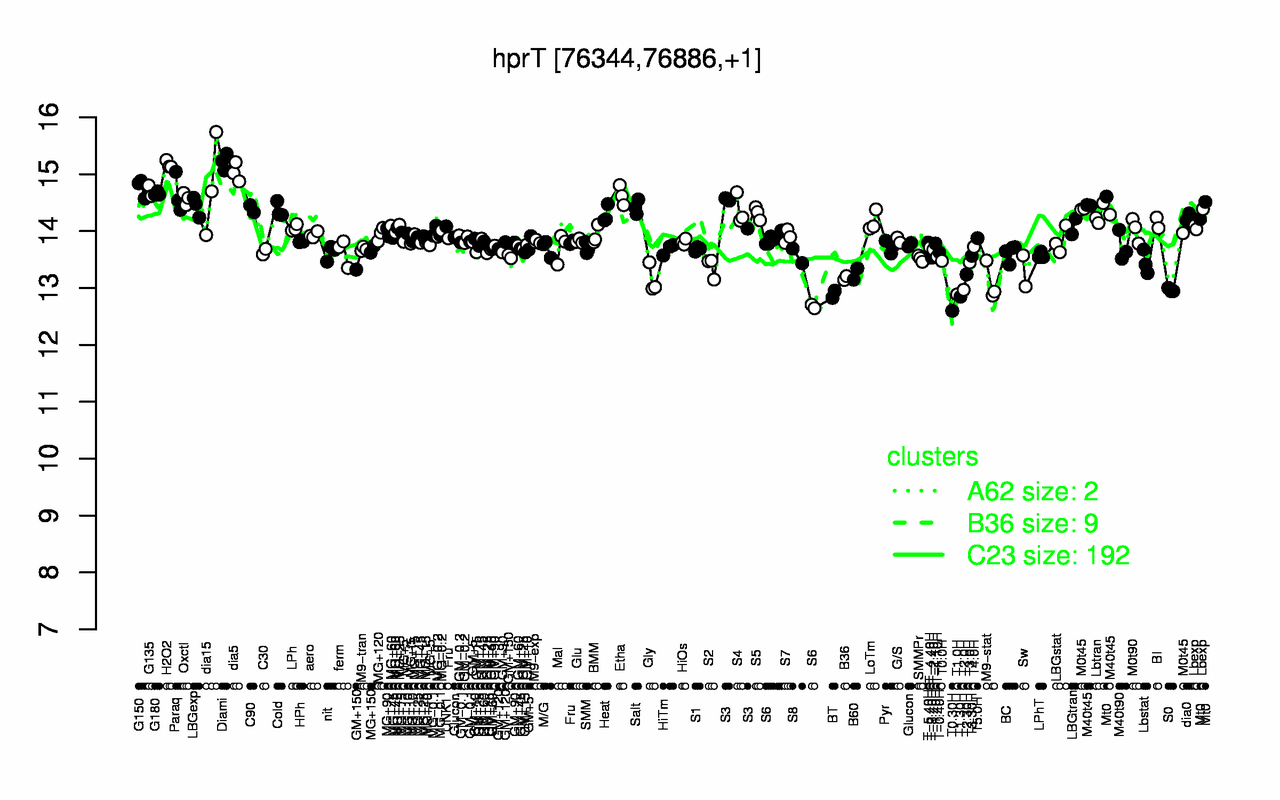
Highest Expression Conditions
Diami H2O2 dia5 dia15 G150 G135 G180 Paraq Etha Oxctl
15.2 15.2 15 14.8 14.8 14.7 14.7 14.7 14.6 14.6
Lowest Expression Conditions
T0.30H T1.30H T1.0H BT S0 T2.0H M9-stat Gly B36 T2.30H
12.6 12.8 12.9 12.9 13 13 13.1 13.2 13.2 13.2
Most Positively Correlated Segments
S38 ytcI yllA recR S537 ftsH yktB tilS ispF S1067
0.94 0.77 0.77 0.77 0.76 0.76 0.75 0.75 0.75 0.74
Most Negatively Correlated Segments
S717 S978 S809 ytzJ yozY yozM rapA phrA S1534 appB
-0.84 -0.7 -0.69 -0.69 -0.68 -0.67 -0.66 -0.66 -0.66 -0.65
Expression Profile of Segment hprT Show/Hide
Annotation of Gene hprT Show/Hide
function
16.11: Scavenge (Catabolism)
inference
ab initio prediction:AMIGene:2.0
codon_start
1
EC_number
2.4.2.8
transl_table
11
note
Evidence 2a: Function of homologous gene experimentally demonstrated in an other organism; PubMedId: 3110131, 6408059; Product type e: enzyme
db_xref
GI:2632335
product
hypoxanthine-guanine phosphoribosyltransferase
protein_id
CAB11844.1
Genomic View of Gene/Segment hprT Show/Hide
(Legend)