| Start Page |
|
 |
| Start Page |
|
|
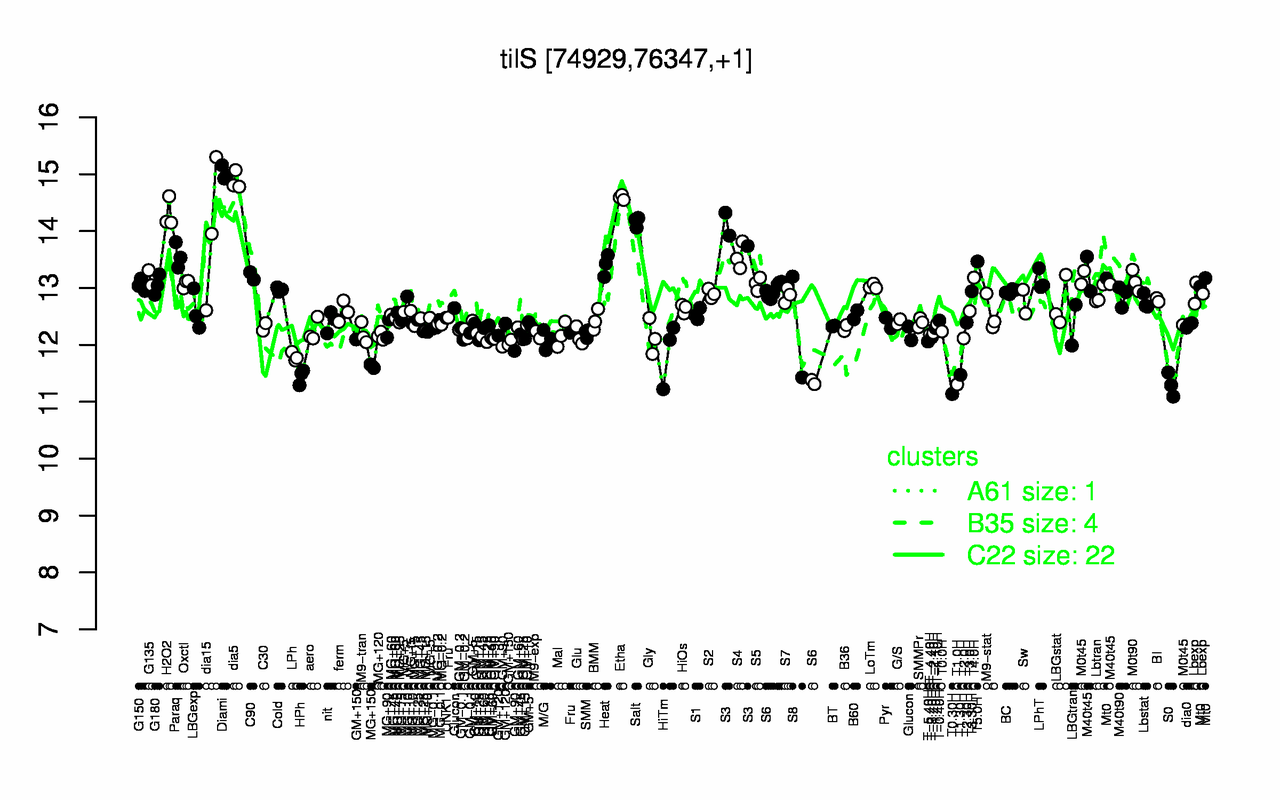
| Diami | dia5 | Etha | H2O2 | Salt | S3 | dia15 | Paraq | S4 | T5.0H |
| 15 | 14.9 | 14.6 | 14.3 | 14.2 | 14 | 14 | 13.6 | 13.6 | 13.5 |
| T0.30H | S0 | T1.0H | HPh | T1.30H | MG+150 | LPh | HiTm | GM+90 | T-5.40H |
| 11.1 | 11.3 | 11.3 | 11.4 | 11.5 | 11.6 | 11.8 | 11.9 | 12 | 12.1 |