B. subtilis Expression Data Browser
Details about moaC Show/Hide
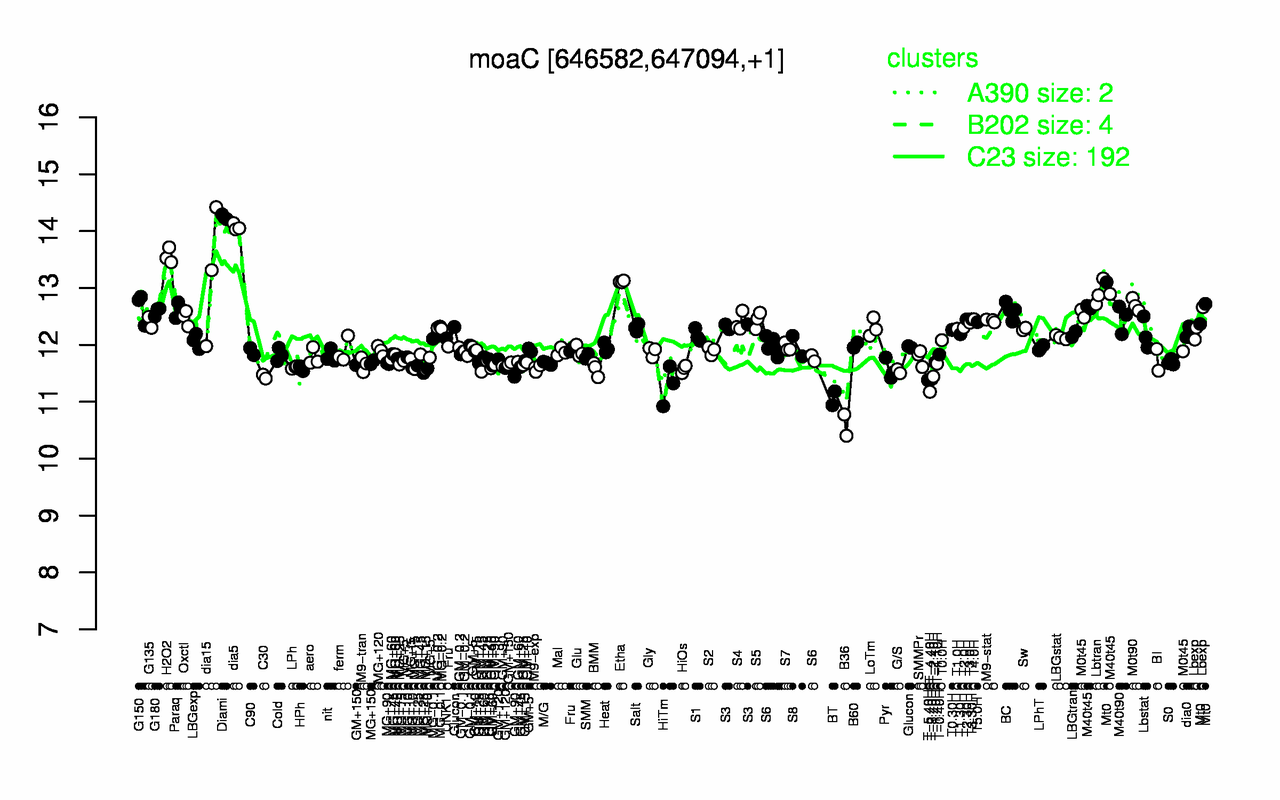
Highest Expression Conditions
Diami dia5 H2O2 dia15 Etha Lbtran M40t45 Mt0 M0t90 G150
14.2 14.1 13.6 13.2 13.1 12.9 12.7 12.7 12.7 12.7
Lowest Expression Conditions
B36 BT T-4.40H HiTm T-5.40H T-3.40H C30 T-2.40H G/S Pyr
10.6 11.1 11.2 11.3 11.4 11.4 11.4 11.4 11.5 11.6
Most Positively Correlated Segments
rex S206 yxeI tilS S205 S191 yxeJ S1117 ydfQ salA
0.88 0.81 0.78 0.77 0.73 0.72 0.72 0.71 0.71 0.7
Most Negatively Correlated Segments
bioF bioK bioD bioYB S1154 opuCD S1155 bioW bioB S101
-0.64 -0.63 -0.63 -0.63 -0.62 -0.62 -0.62 -0.62 -0.62 -0.62
Expression Profile of Segment moaC Show/Hide
Annotation of Gene moaC Show/Hide
function
16.2: Construct biomass (Anabolism)
inference
ab initio prediction:AMIGene:2.0
codon_start
1
product
molybdenum cofactor biosynthesis protein C
transl_table
11
note
Evidence 2a: Function of homologous gene experimentally demonstrated in an other organism; PubMedId: 10903949; Product type e: enzyme
db_xref
GI:2632909
protein_id
CAB12415.1
Genomic View of Gene/Segment moaC Show/Hide
(Legend)