| Start Page |
|
 |
| Start Page |
|
|
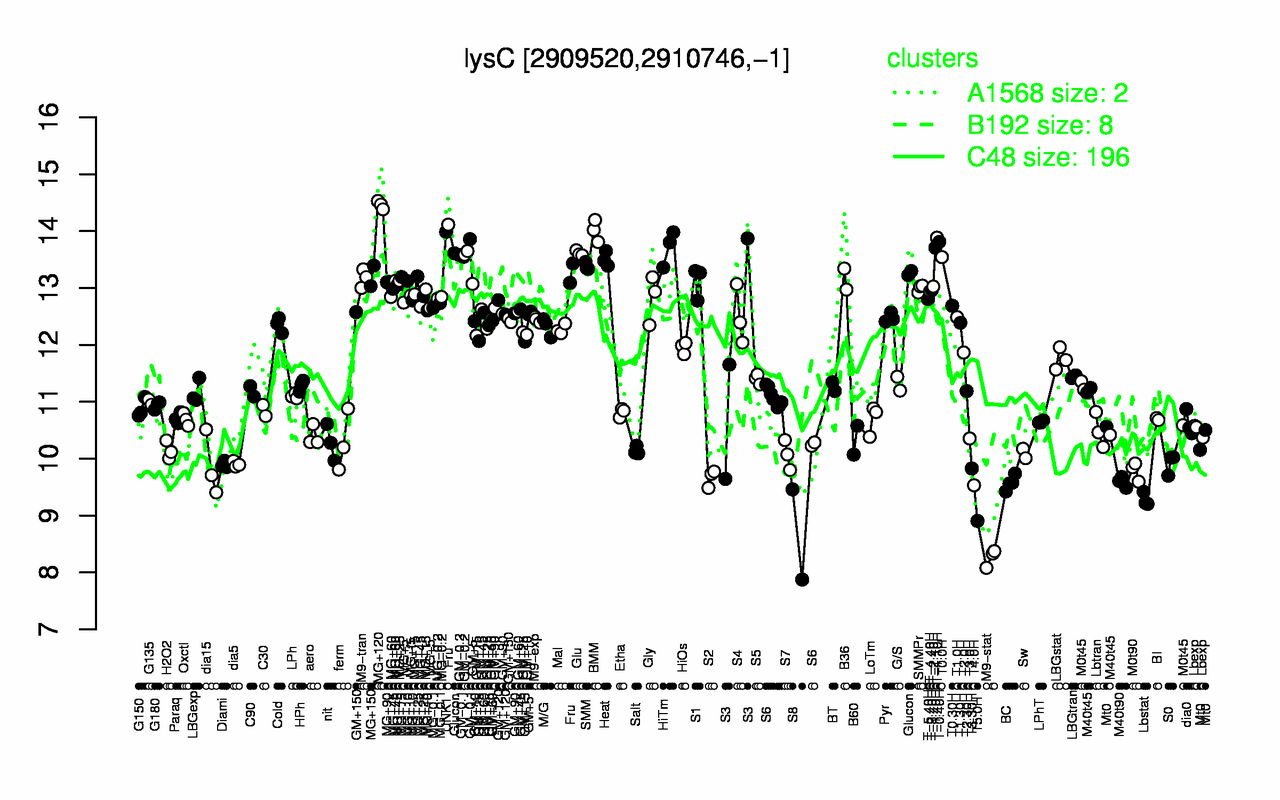
| MG+120 | BMM | UNK1 | T-1.10H | T-0.40H | HiTm | T-1.40H | GM-0.1 | Glu | GM-0.2 |
| 14.5 | 14 | 14 | 13.9 | 13.8 | 13.7 | 13.7 | 13.7 | 13.6 | 13.6 |
| M9-stat | S8 | T5.0H | Lbstat | T4.0H | BC | M40t90 | S2 | M0t90 | T3.30H |
| 8.26 | 8.67 | 8.91 | 9.28 | 9.53 | 9.58 | 9.59 | 9.66 | 9.79 | 9.83 |