| Start Page |
|
 |
| Start Page |
|
|
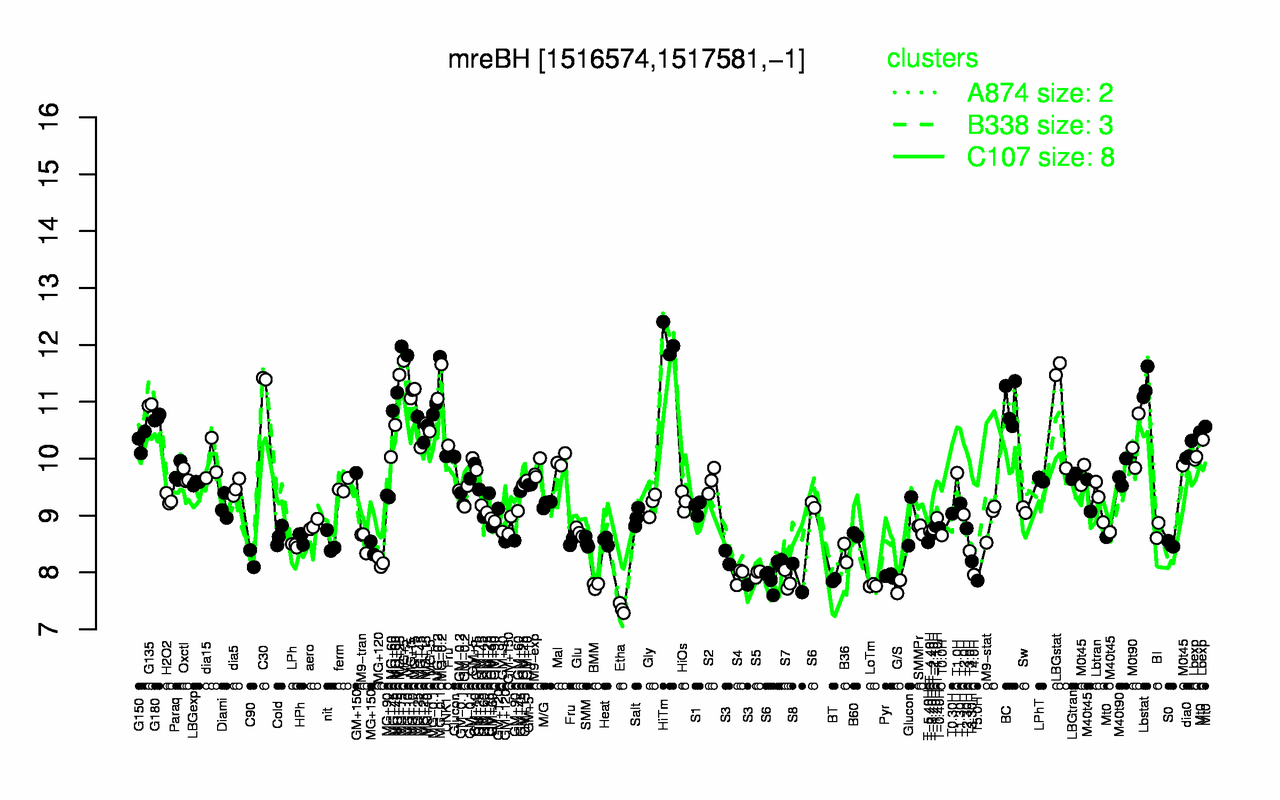
| HiTm | C30 | MG-0.2 | Lbstat | MG+15 | MG+10 | MG-0.1 | MG+5 | MG+t5 | LBGstat |
| 12.1 | 11.4 | 11.4 | 11.3 | 11.3 | 11.2 | 11.2 | 11.1 | 11.1 | 11 |
| Etha | G/S | BMM | LoTm | S7 | T5.0H | BT | S8 | Pyr | S4 |
| 7.37 | 7.75 | 7.77 | 7.77 | 7.85 | 7.86 | 7.86 | 7.9 | 7.94 | 7.94 |