| Start Page |
|
 |
| Start Page |
|
|
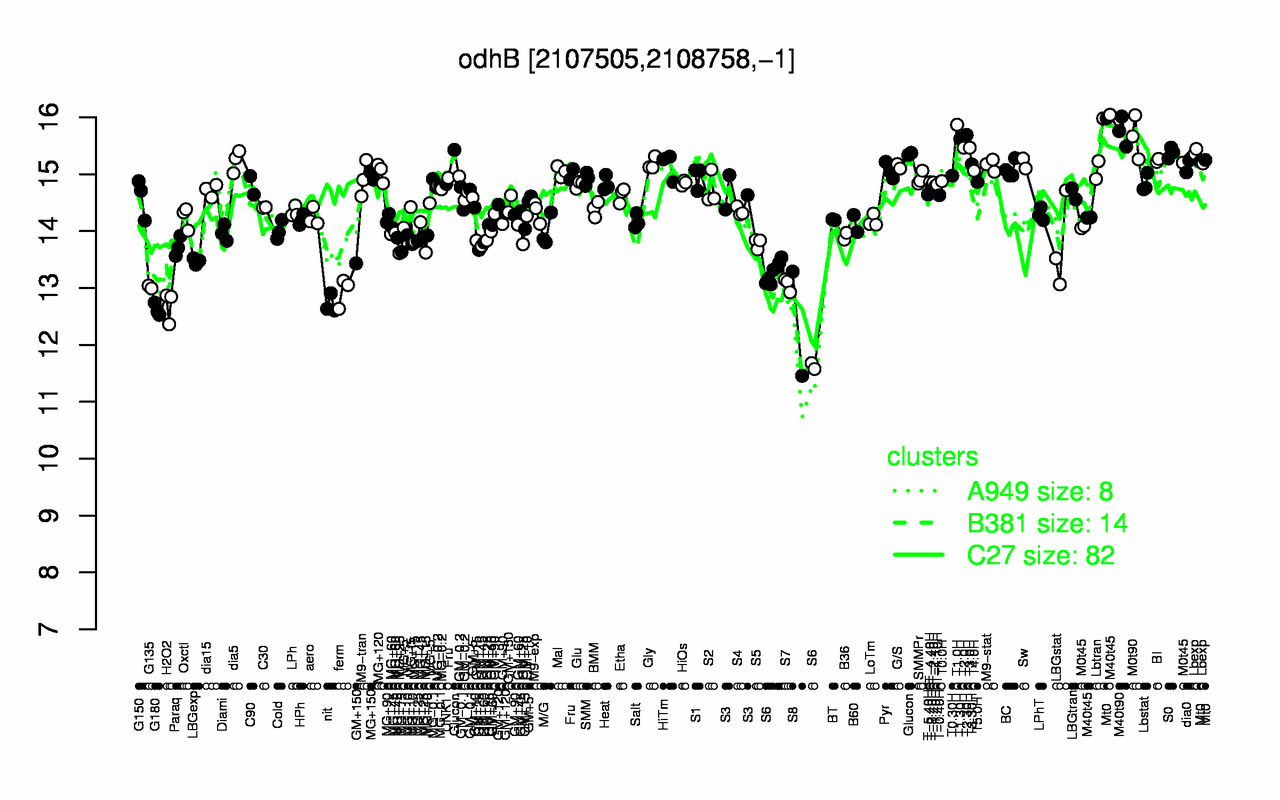
| T1.0H | M40t90 | T2.30H | M0t90 | T1.30H | Mt0 | T2.0H | T3.0H | Glucon | Lbtran |
| 15.9 | 15.8 | 15.7 | 15.7 | 15.6 | 15.5 | 15.5 | 15.5 | 15.4 | 15.4 |
| S8 | G180 | H2O2 | nit | S6 | ferm | G135 | S7 | LBGexp | MG+15 |
| 12.4 | 12.6 | 12.7 | 12.7 | 12.9 | 12.9 | 13 | 13.1 | 13.5 | 13.7 |