| Start Page |
|
 |
| Start Page |
|
|
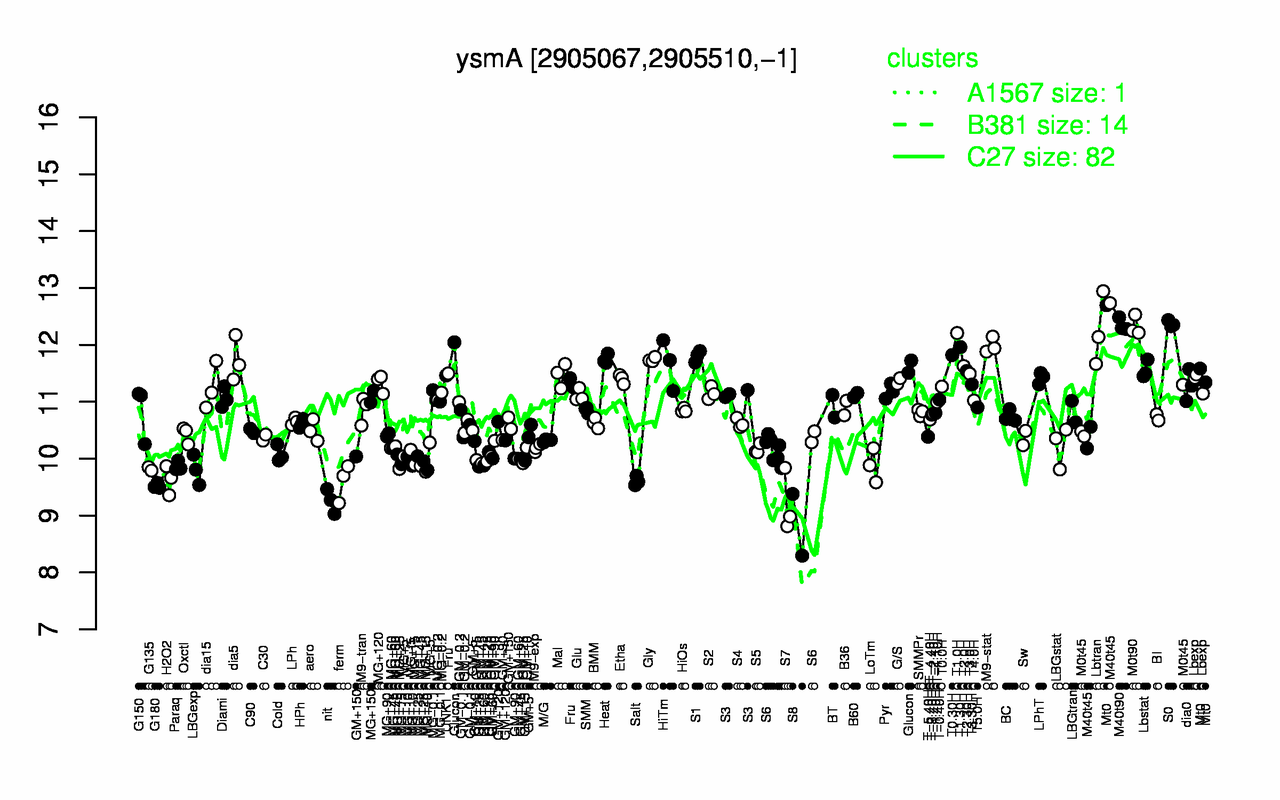
| S0 | M40t90 | M0t90 | Lbtran | T1.0H | M9-stat | T1.30H | Mt0 | T0.30H | S1 |
| 12.4 | 12.4 | 12.3 | 12.2 | 12.2 | 12 | 12 | 11.9 | 11.8 | 11.8 |
| S8 | S7 | nit | G180 | ferm | Salt | H2O2 | LBGexp | G135 | MG+15 |
| 8.84 | 9.21 | 9.26 | 9.52 | 9.59 | 9.61 | 9.63 | 9.8 | 9.82 | 9.86 |