| Start Page |
|
 |
| Start Page |
|
|
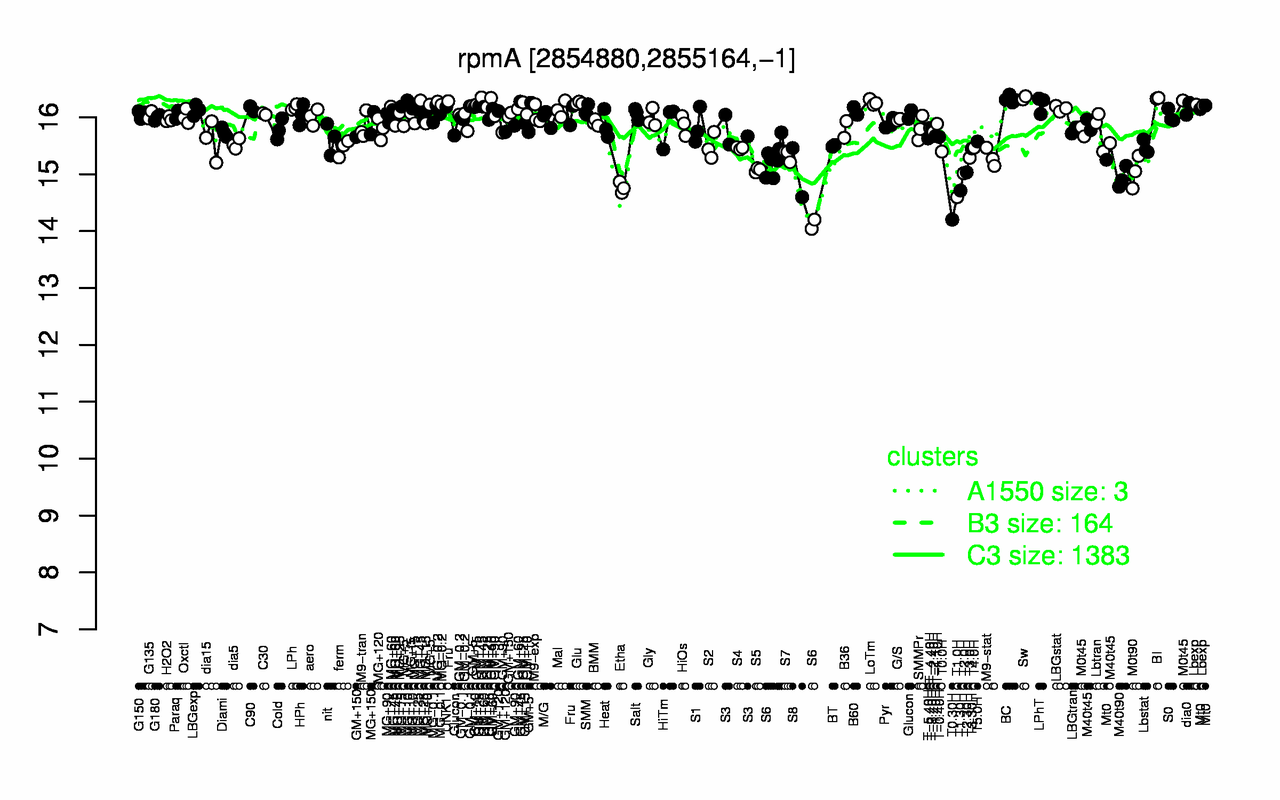
| Sw | BI | GM+45 | BC | LoTm | Glu | MG-0.2 | LPhT | GM+25 | Lbexp |
| 16.3 | 16.3 | 16.3 | 16.3 | 16.3 | 16.3 | 16.2 | 16.2 | 16.2 | 16.2 |
| T0.30H | T1.0H | T1.30H | Etha | M40t90 | T2.0H | S6 | S8 | T2.30H | M0t90 |
| 14.2 | 14.6 | 14.7 | 14.8 | 14.9 | 15 | 15 | 15 | 15 | 15 |