| Start Page |
|
 |
| Start Page |
|
|
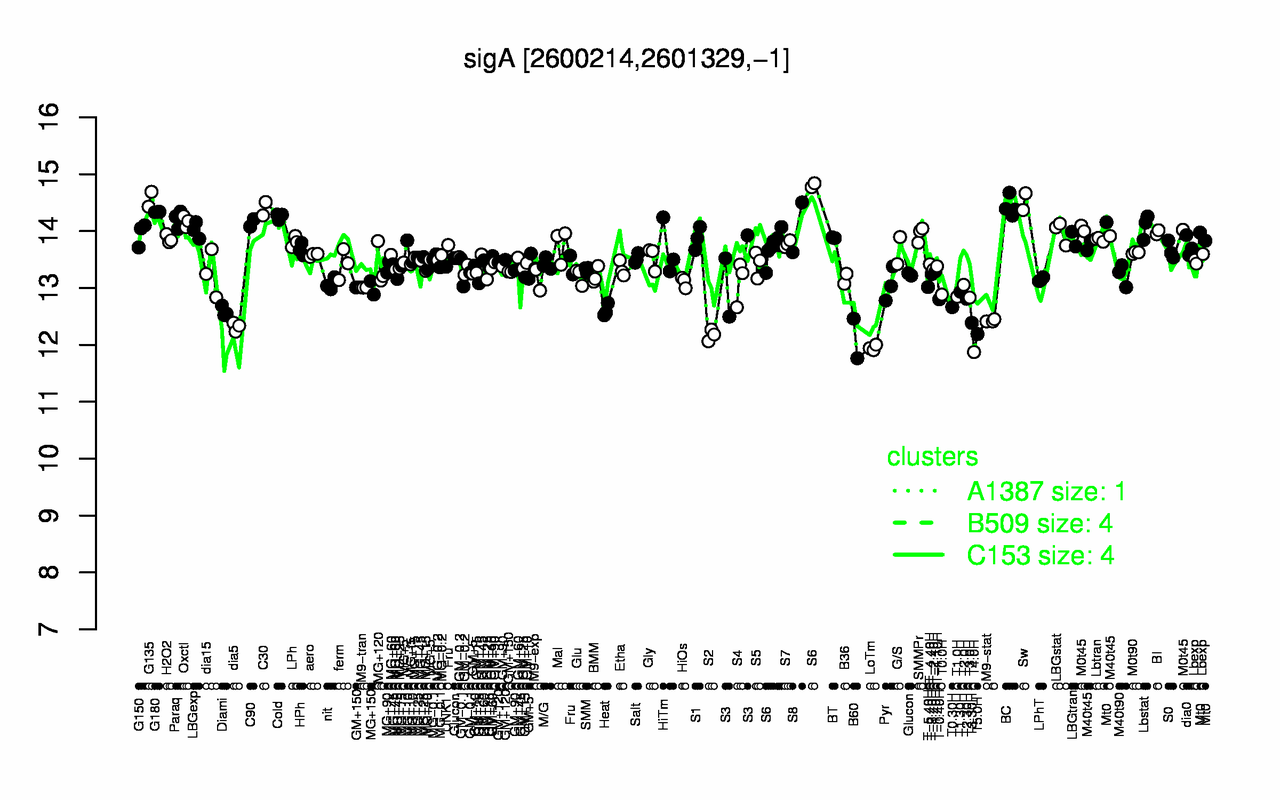
| G135 | Sw | BC | C30 | G180 | Cold | Paraq | Oxctl | C90 | Lbstat |
| 14.6 | 14.5 | 14.4 | 14.4 | 14.3 | 14.3 | 14.2 | 14.2 | 14.1 | 14.1 |
| T4.0H | LoTm | B60 | S2 | T5.0H | dia5 | T3.30H | M9-stat | Diami | Heat |
| 11.9 | 12 | 12.1 | 12.2 | 12.2 | 12.3 | 12.4 | 12.4 | 12.6 | 12.6 |