| Start Page |
|
 |
| Start Page |
|
|
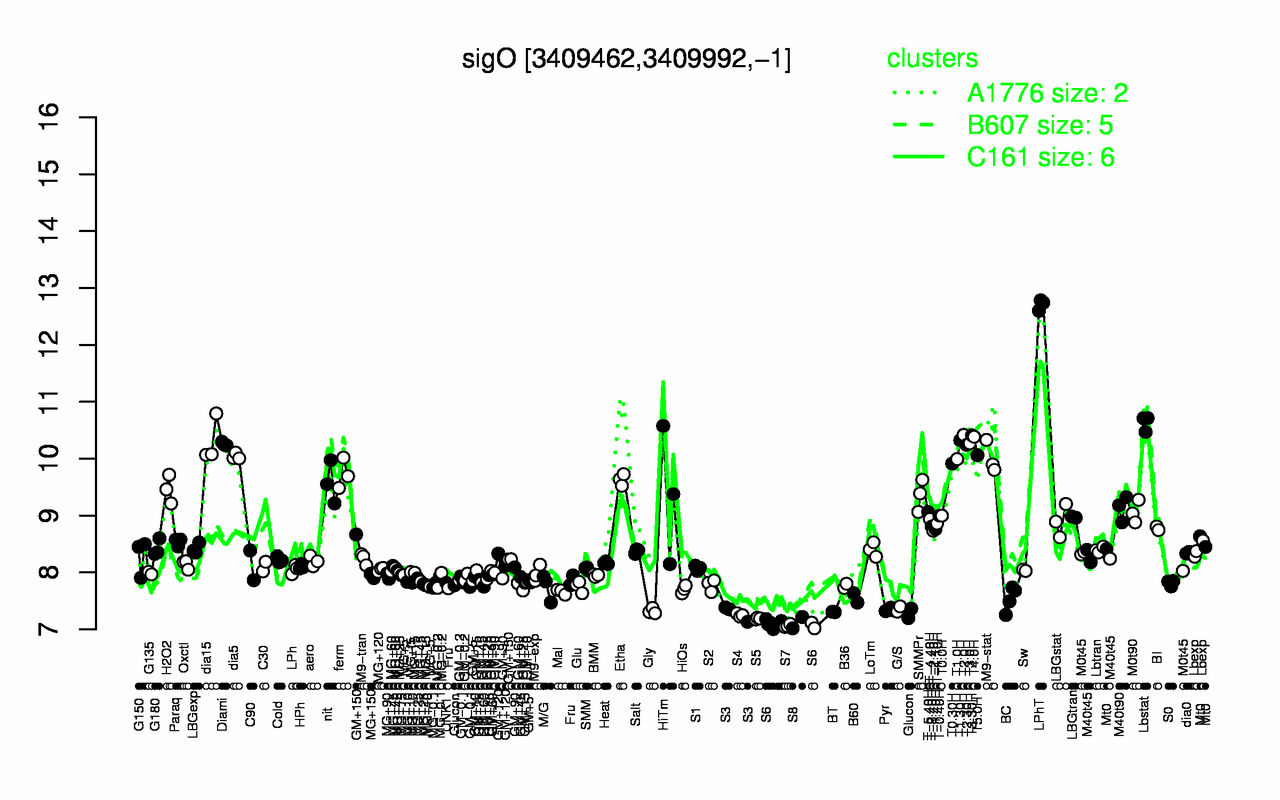
| LPhT | Lbstat | T2.0H | T3.30H | T4.0H | T1.30H | dia15 | T3.0H | Diami | T2.30H |
| 12.7 | 10.6 | 10.4 | 10.4 | 10.4 | 10.3 | 10.3 | 10.3 | 10.3 | 10.2 |
| S7 | S6 | S8 | S5 | S4 | S3 | BT | Gly | Pyr | G/S |
| 7.06 | 7.09 | 7.12 | 7.19 | 7.25 | 7.29 | 7.31 | 7.32 | 7.34 | 7.36 |