| Start Page |
|
 |
| Start Page |
|
|
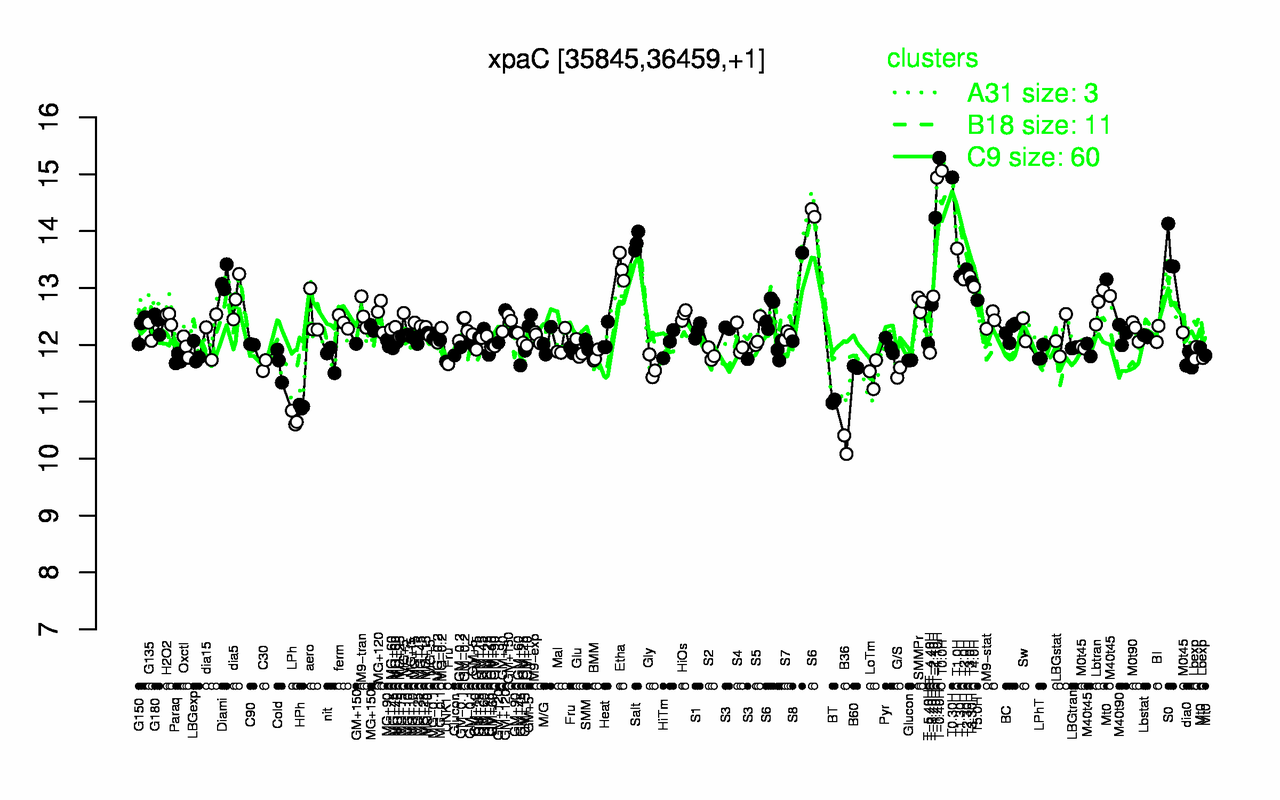
| T-0.40H | T0.0H | T0.30H | T-1.10H | T-1.40H | Salt | T1.0H | S0 | Etha | T2.30H |
| 15.3 | 15.1 | 14.9 | 14.9 | 14.2 | 13.8 | 13.7 | 13.6 | 13.4 | 13.3 |
| B36 | LPh | HPh | BT | LoTm | G/S | Gly | B60 | C30 | Cold |
| 10.2 | 10.7 | 10.9 | 11 | 11.5 | 11.5 | 11.6 | 11.6 | 11.6 | 11.7 |