B. subtilis Expression Data Browser
Start Page
B. subtilis Expression Data Browser
Gene/Segment:
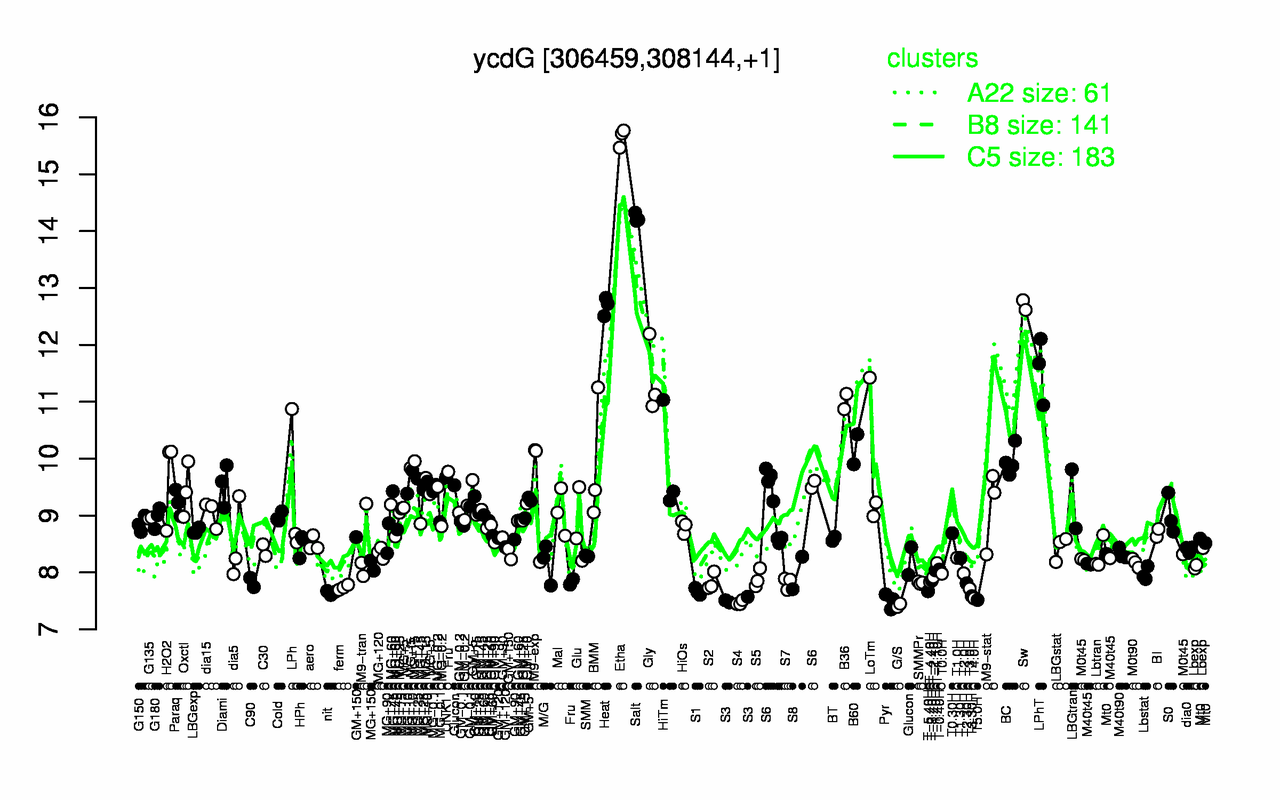
ycdG
Locus Tag:
BSU02840
Details about ycdG
Show/Hide
Highest Expression Conditions
Etha
Salt
Sw
Heat
LPhT
Gly
B36
B60
BC
BMM
15.7
14.2
12.7
12.7
11.6
11.4
11
10.2
9.96
9.92
Lowest Expression Conditions
G/S
S4
Pyr
T5.0H
S3
T4.0H
T3.30H
nit
S1
T-5.40H
7.42
7.47
7.5
7.52
7.52
7.54
7.59
7.64
7.66
7.67
Most Positively Correlated Segments
ycdF
yjgC
yjgD
ywtG
yerD
ygxB
ydaD
ydaE
yxnA
yaaI
0.95
0.95
0.94
0.94
0.93
0.93
0.92
0.92
0.9
0.9
Most Negatively Correlated Segments
ndoA
recO
S957
S1213
yerB
S367
atpF
yqjV
nucA
era
-0.5
-0.47
-0.47
-0.46
-0.45
-0.45
-0.45
-0.45
-0.45
-0.45
Expression Profile of Segment ycdG
Show/Hide
Annotation of Gene ycdG
Show/Hide
function
16.11: Scavenge (Catabolism)
inference
ab initio prediction:AMIGene:2.0
codon_start
1
EC_number
3.2.-.-
transl_table
11
note
Evidence 3: Function proposed based on presence of conserved amino acid motif, structural feature or limited homology; PubMedId: 11544224; Product type pe : putative enzyme
db_xref
GI:2632570
product
putative glycosidase
protein_id
CAB12078.1
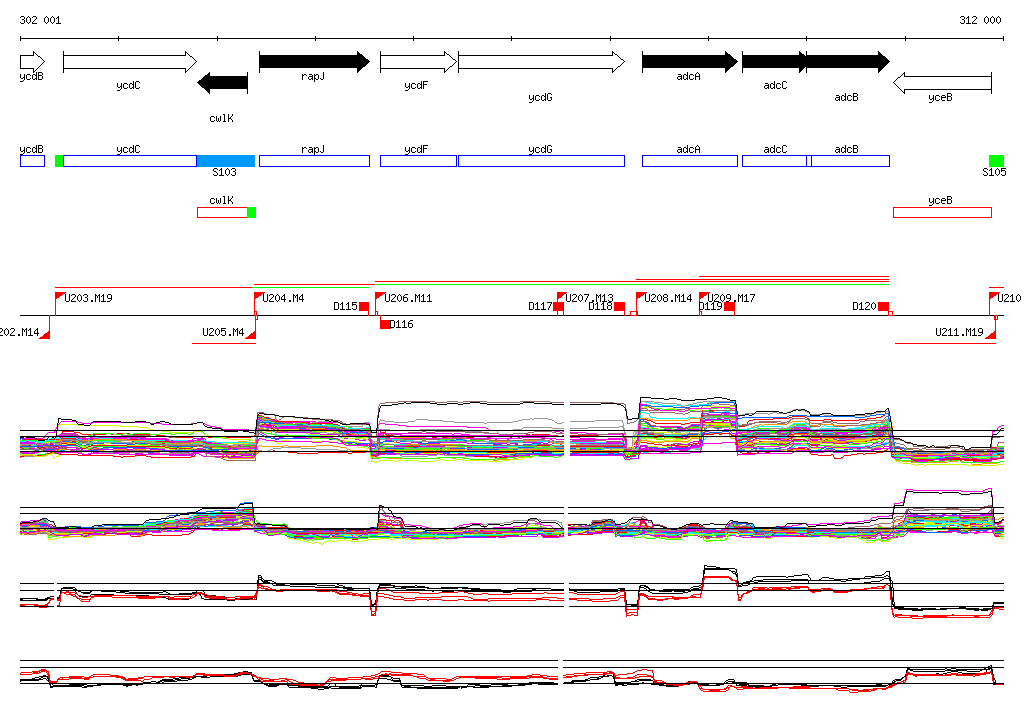
Genomic View of Gene/Segment ycdG
Show/Hide
(Legend)
Browse Genome Context