| Start Page |
|
 |
| Start Page |
|
|
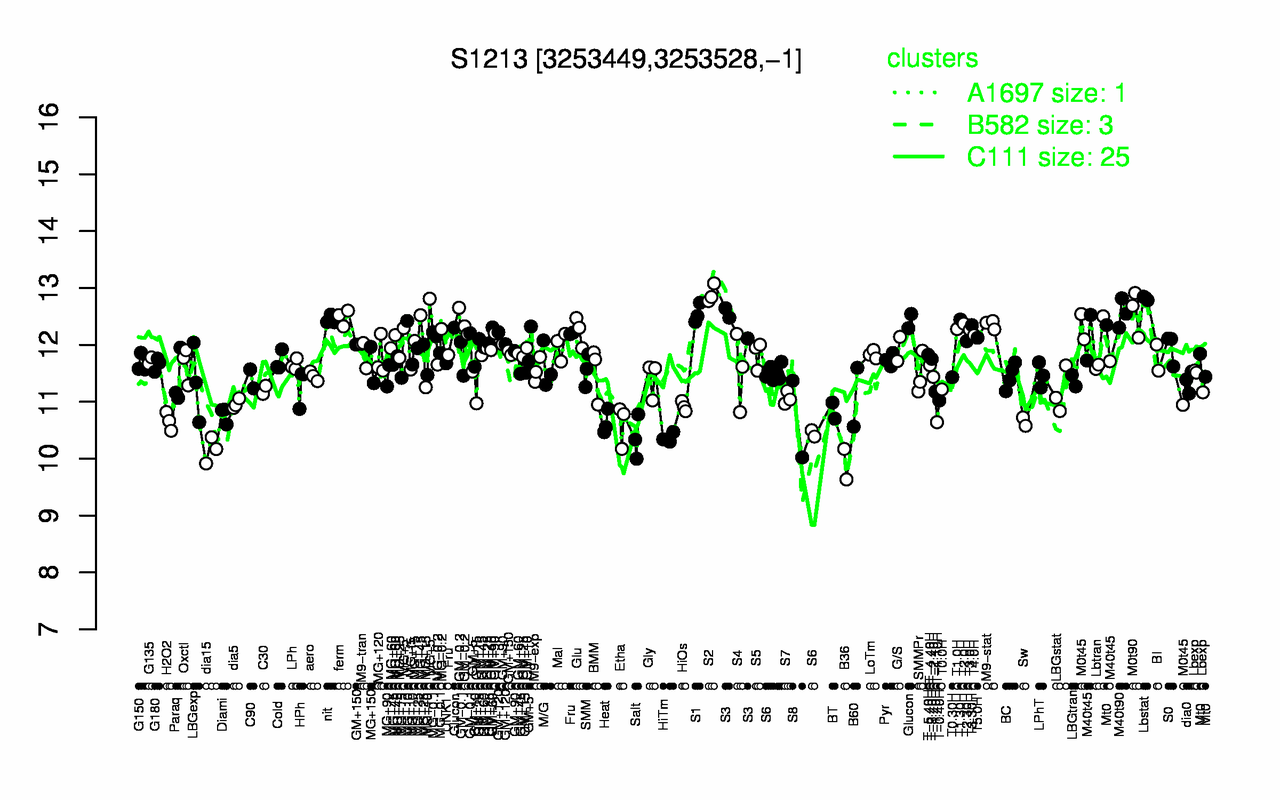
| S2 | Lbstat | M0t90 | M40t90 | MG+5 | S1 | ferm | T1.30H | nit | S3 |
| 12.9 | 12.8 | 12.6 | 12.6 | 12.6 | 12.6 | 12.5 | 12.4 | 12.4 | 12.4 |
| B36 | dia15 | HiTm | Salt | Etha | Heat | T-1.10H | Sw | H2O2 | S8 |
| 9.9 | 10.2 | 10.4 | 10.4 | 10.6 | 10.6 | 10.6 | 10.7 | 10.7 | 10.7 |