| Start Page |
|
 |
| Start Page |
|
|
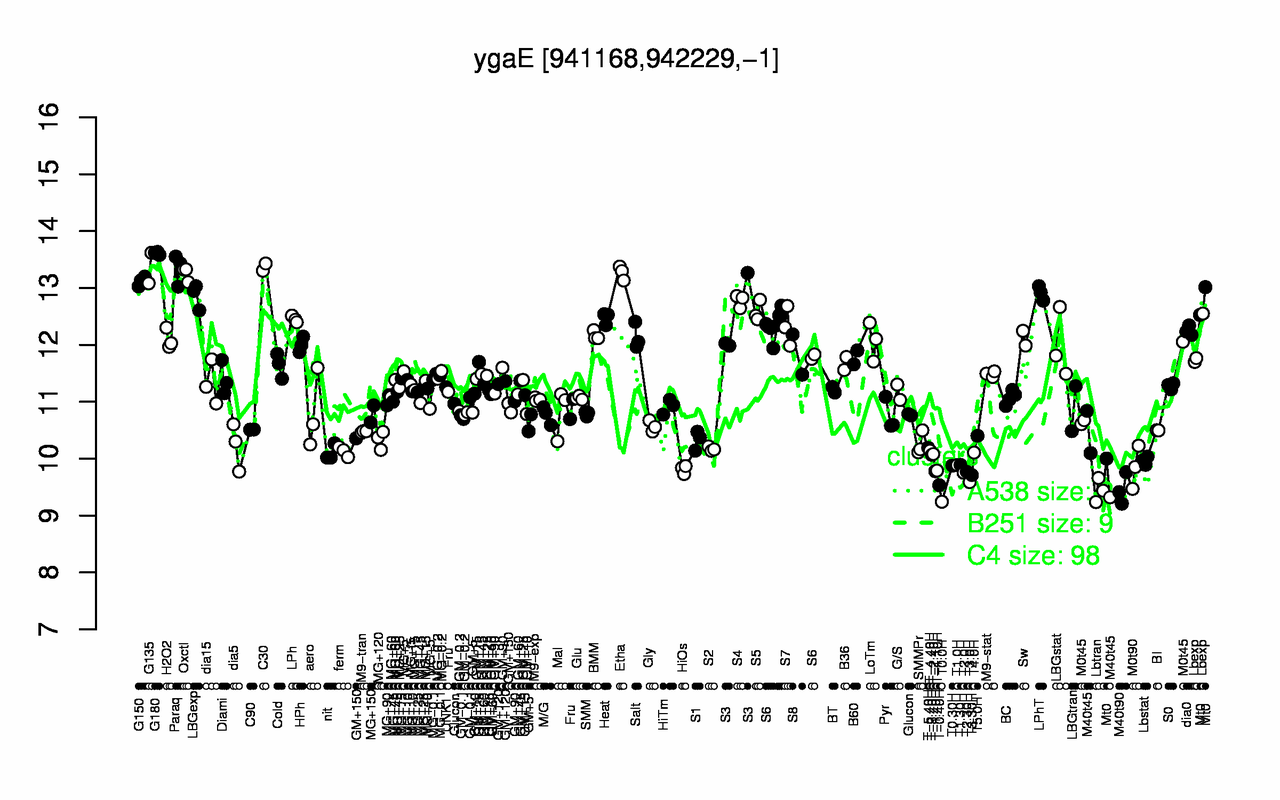
| G180 | C30 | G135 | Paraq | Etha | Oxctl | G150 | LPhT | LBGexp | S4 |
| 13.6 | 13.4 | 13.4 | 13.3 | 13.3 | 13.3 | 13.1 | 12.9 | 12.9 | 12.8 |
| T0.0H | Lbtran | M40t90 | T-0.40H | T3.0H | T3.30H | T2.0H | T2.30H | T-1.40H | T-1.10H |
| 9.24 | 9.44 | 9.46 | 9.53 | 9.59 | 9.71 | 9.75 | 9.77 | 9.78 | 9.79 |