| Start Page |
|
 |
| Start Page |
|
|
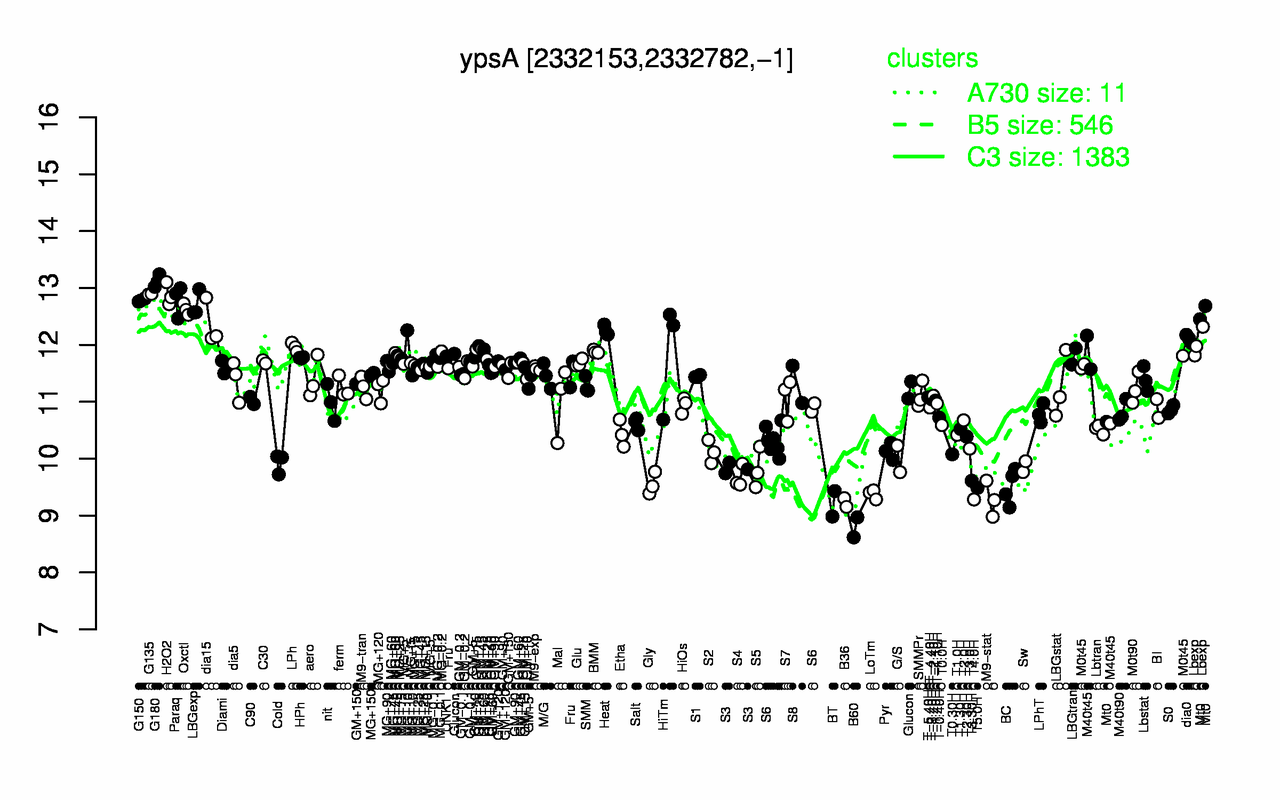
| G180 | G135 | H2O2 | Paraq | G150 | LBGexp | Oxctl | dia15 | Heat | dia0 |
| 13.1 | 12.9 | 12.9 | 12.8 | 12.8 | 12.7 | 12.6 | 12.4 | 12.3 | 12.1 |
| B60 | BT | B36 | T4.0H | M9-stat | LoTm | T5.0H | BC | Gly | T3.30H |
| 8.79 | 9.21 | 9.23 | 9.28 | 9.29 | 9.38 | 9.49 | 9.51 | 9.56 | 9.61 |